Ethereum Loses Ground – Further Dips Could Expose Price To Key Support Zone


Ethereum price started a fresh decline below $4,600 and $4,500. ETH is now moving lower and might extend losses below $4,250 in the short term.
- Ethereum started a downside correction below $4,550 and $4,500.
- The price is trading below $4,450 and the 100-hourly Simple Moving Average.
- There is a key bearish trend line forming with resistance at $4,385 on the hourly chart of ETH/USD (data feed via Kraken).
- The pair could continue to move down if it trades below $4,250.
Ethereum Price Dips Further
Ethereum price failed to stay above $4,550 and started a fresh decline, like Bitcoin . ETH price dipped below the $4,500 and $4,450 levels to enter a bearish zone.
The price tested the $4,270 zone. A low was formed at $4,270 and the price is now consolidating losses. There was a minor recovery wave toward the 23.6% Fib retracement level of the recent decline from the $4,760 swing high to the $4,270 low.
However, the bears are active near the $4,380 level. Besides, there is a key bearish trend line forming with resistance at $4,385 on the hourly chart of ETH/USD.
Ethereum price is now trading below $4,450 and the 100-hourly Simple Moving Average . On the upside, the price could face resistance near the $4,385 level and the trend line. The next key resistance is near the $4,450 level.
The first major resistance is near the $4,510 level or the 50% Fib retracement level of the recent decline from the $4,760 swing high to the $4,270 low. A clear move above the $4,510 resistance might send the price toward the $4,570 resistance. An upside break above the $4,570 region might call for more gains in the coming sessions. In the stated case, Ether could rise toward the $4,640 resistance zone or even $4,720 in the near term.
More Losses In ETH?
If Ethereum fails to clear the $4,450 resistance, it could start a fresh decline. Initial support on the downside is near the $4,320 level. The first major support sits near the $4,270 zone.
A clear move below the $4,270 support might push the price toward the $4,250 support. Any more losses might send the price toward the $4,150 region in the near term. The next key support sits at $4,120.
Technical Indicators
Hourly MACD – The MACD for ETH/USD is gaining momentum in the bearish zone.
Hourly RSI – The RSI for ETH/USD is now below the 50 zone.
Major Support Level – $4,320
Major Resistance Level – $4,450
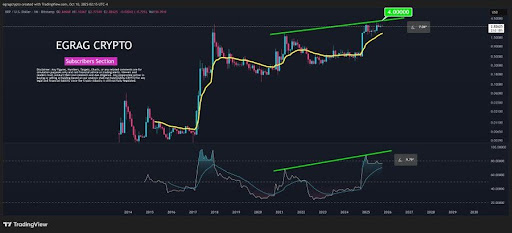
XRP Bullish Symphony: Price And RSI Align For A Run Toward $4
XRP is showing signs of a powerful bullish resurgence as both price action and momentum indicators m...

Digital Assets Demand Rising: 1 In 2 Institutions To Increase Holdings Within A Year
According to State Street’s 2025 global research, big investors are moving past trial runs and makin...
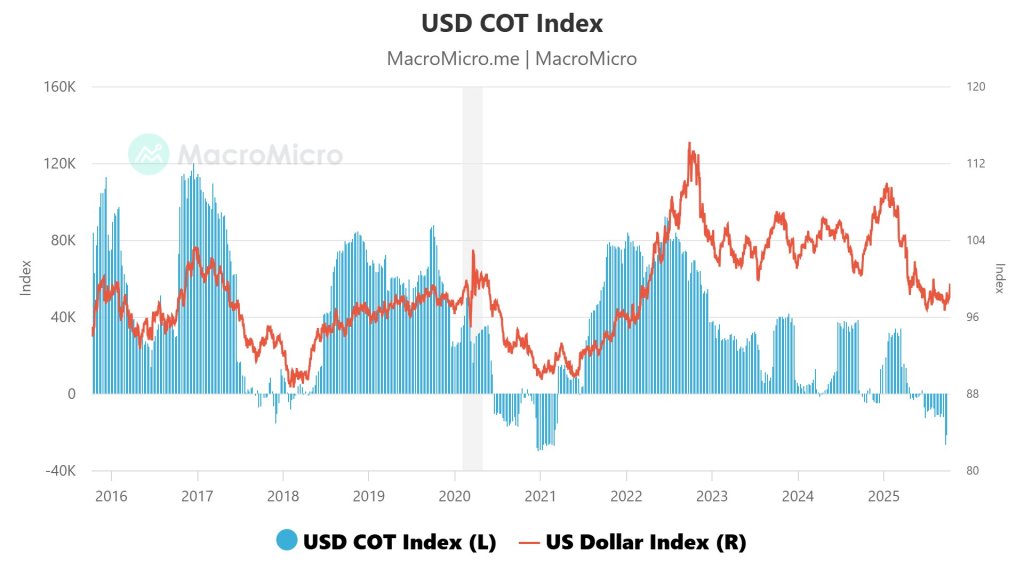
Something Else Is Moving Bitcoin — Here’s What The Charts Reveal
Bitcoin’s latest pullback has little to do with crypto-native flows and everything to do with the do...