Dogecoin (DOGE) Resilient Above $0.20 – Can Momentum Shift Toward Fresh Upside?


Dogecoin started a fresh increase above the $0.20 zone against the US Dollar. DOGE is now consolidating and might aim for more gains if it clears $0.2180.
- DOGE price started a fresh upward move above $0.20 and $0.2050.
- The price is trading above the $0.20 level and the 100-hourly simple moving average.
- There is a bullish trend line forming with support at $0.1980 on the hourly chart of the DOGE/USD pair (data source from Kraken).
- The price could aim for more gains if it remains stable above $0.1880.
Dogecoin Price Eyes Fresh Upside
Dogecoin price started a fresh increase after it settled above $0.1880, like Bitcoin and Ethereum . DOGE climbed above the $0.20 resistance to enter a positive zone.
The bulls were able to push the price above $0.2050 and $0.2120. A high was formed at $0.2182 and the price is now correcting gains. There was a move below the 50% Fib retracement level of the recent wave from the $0.1787 swing low to the $0.2182 high.
Dogecoin price is now trading above the $0.20 level and the 100-hourly simple moving average. Besides, there is a bullish trend line forming with support at $0.1980 on the hourly chart of the DOGE/USD pair.
If there is another increase, immediate resistance on the upside is near the $0.2085 level. The first major resistance for the bulls could be near the $0.2120 level. The next major resistance is near the $0.2180 level. A close above the $0.2180 resistance might send the price toward $0.2320. Any more gains might send the price toward $0.250. The next major stop for the bulls might be $0.2620.
Another Decline In DOGE?
If DOGE’s price fails to climb above the $0.2120 level, it could start a downside correction. Initial support on the downside is near the $0.20 level. The next major support is near the $0.1980 level and the trend line.
The main support sits at $0.1880. If there is a downside break below the $0.1880 support, the price could decline further. In the stated case, the price might slide toward the $0.1720 level or even $0.1650 in the near term.
Technical Indicators
Hourly MACD – The MACD for DOGE/USD is now losing momentum in the bullish zone.
Hourly RSI (Relative Strength Index) – The RSI for DOGE/USD is now below the 50 level.
Major Support Levels – $0.1980 and $0.1880.
Major Resistance Levels – $0.2120 and $0.2180.
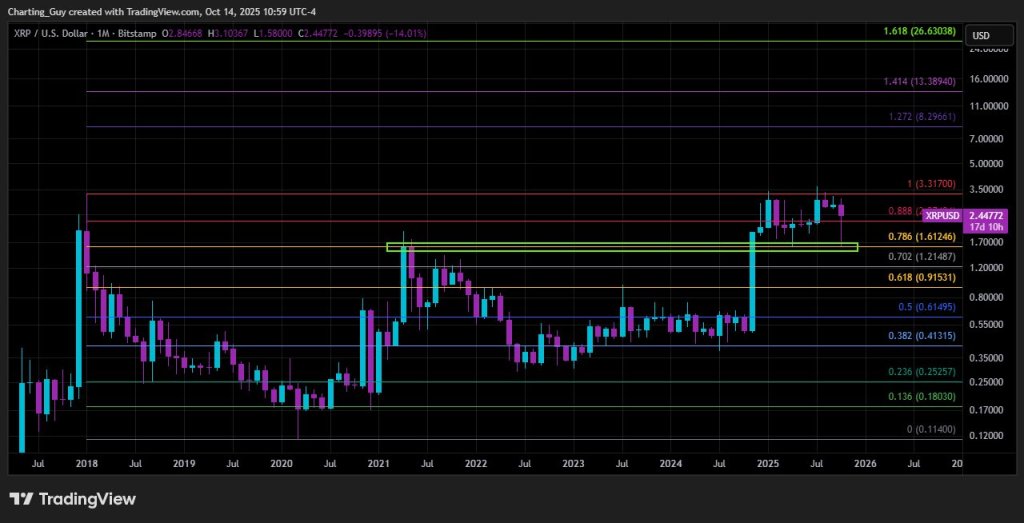
$26 XRP Price Target Remains Technically Valid, Says Expert
The XRP monthly chart remains structurally constructive despite last week’s sharp pullback, accordin...
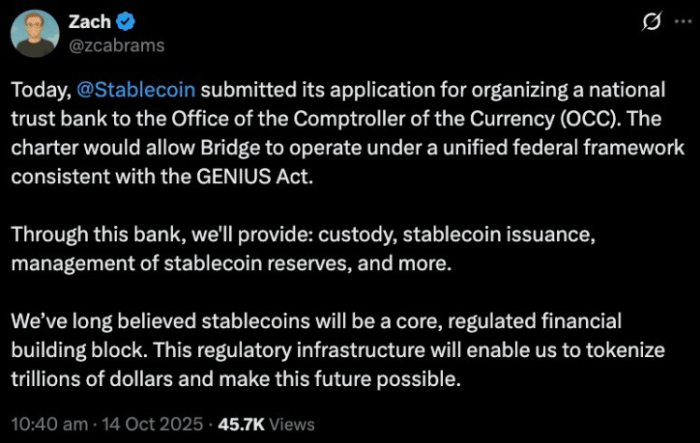
Stripe’s Bridge Leads the Stablecoin Season, and Could Boost Best Wallet Token
What to Know: Stripe’s stablecoin arm, Bridge, has applied for a US national trust bank charter unde...
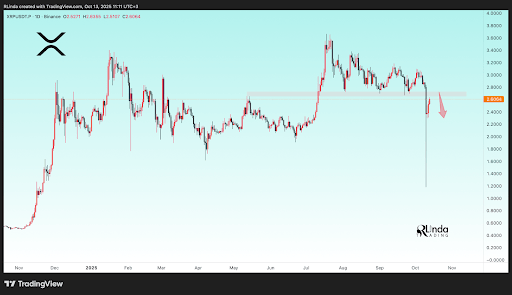
Why This Resistance Could Trigger Another XRP Price Crash Soon
A recent analysis by R. Linda on TradingView shows that the XRP price is facing a tough resistance z...