Bitcoin Correction Deepens – Traders Cautious As Downside Pressure Builds Further


Bitcoin price corrected gains and traded below the $124,000 level. BTC is now struggling and might continue to move down below $120,000.
- Bitcoin started a downside correction below the $123,200 level.
- The price is trading below $123,000 and the 100 hourly Simple moving average.
- There is a bearish trend line forming with resistance at $122,750 on the hourly chart of the BTC/USD pair (data feed from Kraken).
- The pair might continue to move down if it trades below the $120,000 zone.
Bitcoin Price Dips Further
Bitcoin price failed to stay above the $125,000 zone and started a fresh decline . BTC dipped below the $124,000 support to enter a short-term bearish zone.
The bears even pushed the price below $121,200. A low was formed at $119,810 and the price recently recovered some losses. There was a move toward the 50% Fib retracement level of the recent decline from the $123,750 swing high to the $119,810 low.
However, the bears are still active near $121,750. Bitcoin is now trading below $121,500 and the 100 hourly Simple moving average . Besides, there is a bearish trend line forming with resistance at $122,750 on the hourly chart of the BTC/USD pair.
Immediate resistance on the upside is near the $121,750 level. The first key resistance is near the $122,250 level and the 61.8% Fib retracement level of the recent decline from the $123,750 swing high to the $119,810 low.
The next resistance could be $122,750 and the trend line. A close above the $122,750 resistance might send the price further higher. In the stated case, the price could rise and test the $123,500 resistance. Any more gains might send the price toward the $124,000 level. The next barrier for the bulls could be $125,500.
More Losses In BTC?
If Bitcoin fails to rise above the $122,750 resistance zone, it could start a fresh decline. Immediate support is near the $120,750 level. The first major support is near the $120,000 level.
The next support is now near the $118,500 zone. Any more losses might send the price toward the $116,500 support in the near term. The main support sits at $115,500, below which BTC might struggle to recover in the short term.
Technical indicators:
Hourly MACD – The MACD is now gaining pace in the bearish zone.
Hourly RSI (Relative Strength Index) – The RSI for BTC/USD is now below the 50 level.
Major Support Levels – $120,750, followed by $120,000.
Major Resistance Levels – $122,750 and $123,500.
Is The XRP Bottom In? Pundit Claims ‘Sellers Are Exhausted’
Crypto commentator Zach Rector argues that XRP’s months-long malaise is nearing a turning point, con...
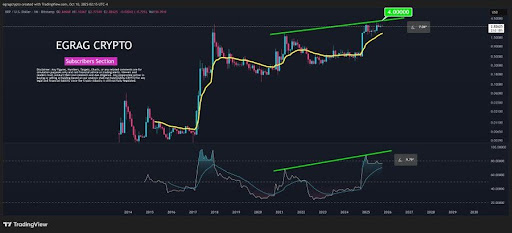
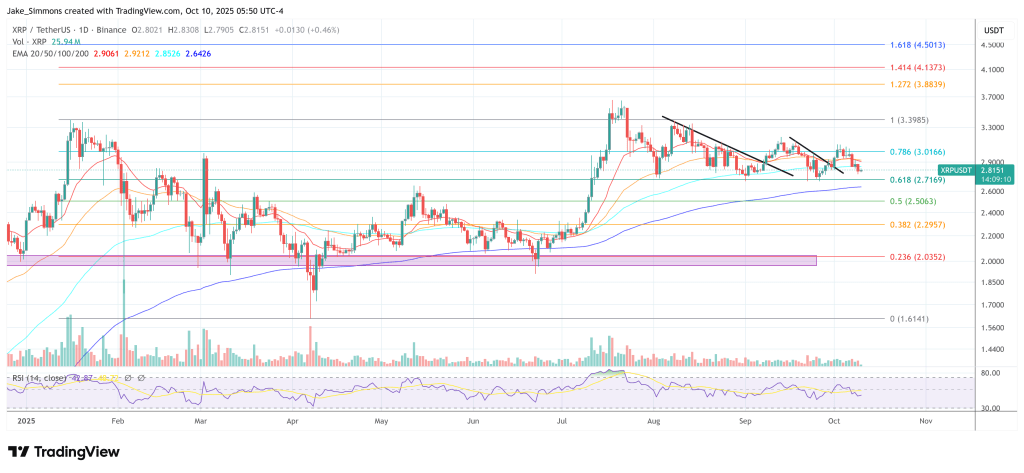
XRP Bullish Symphony: Price And RSI Align For A Run Toward $4
XRP is showing signs of a powerful bullish resurgence as both price action and momentum indicators m...

Digital Assets Demand Rising: 1 In 2 Institutions To Increase Holdings Within A Year
According to State Street’s 2025 global research, big investors are moving past trial runs and makin...