Solana (SOL) Moves Higher – Bulls Target Next Big Level as Volume Builds


Solana started a fresh increase above the $245 zone. SOL price is now correcting some gains and might find bids near $242 or $240.
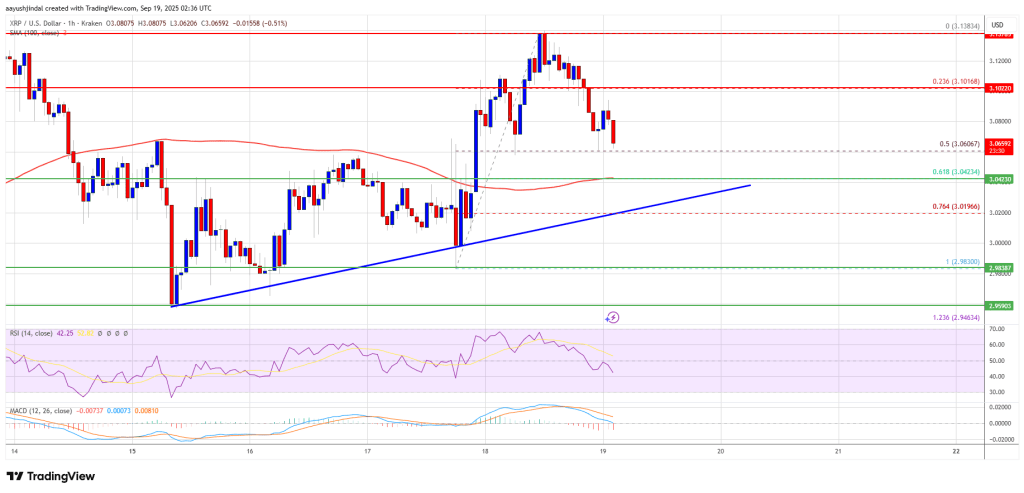
- SOL price started a fresh upward move above the $242 and $245 levels against the US Dollar.
- The price is now trading above $240 and the 100-hourly simple moving average.
- There was a break above a key bearish trend line with resistance at $240 on the hourly chart of the SOL/USD pair (data source from Kraken).
- The pair could extend losses if it dips below the $240 zone.
Solana Price Corrects Some Gains
Solana price started a decent increase after it settled above the $232 zone, beating Bitcoin and Ethereum . SOL climbed above the $240 level to enter a short-term positive zone.
There was a break above a key bearish trend line with resistance at $240 on the hourly chart of the SOL/USD pair. The price even smashed the $245 resistance. The bulls were able to push the price above the $250 barrier. A high was formed near $253 and the price recently corrected some gains.
There was a move below the 23.6% Fib retracement level of the upward wave from the $232 swing low to the $253 high. However, the bulls were active above $242.
Solana is now trading above $242 and the 100-hourly simple moving average. On the upside, the price is facing resistance near the $248 level. The next major resistance is near the $254 level. The main resistance could be $255. A successful close above the $255 resistance zone could set the pace for another steady increase. The next key resistance is $268. Any more gains might send the price toward the $272 level.
More Losses In SOL?
If SOL fails to rise above the $248 resistance, it could start another decline. Initial support on the downside is near the $242 zone and the 50% Fib retracement level of the upward wave from the $232 swing low to the $253 high. The first major support is near the $240 level.
A break below the $240 level might send the price toward the $232 support zone. If there is a close below the $232 support, the price could decline toward the $220 support in the near term.
Technical Indicators
Hourly MACD – The MACD for SOL/USD is losing pace in the bullish zone.
Hourly Hours RSI (Relative Strength Index) – The RSI for SOL/USD is below the 50 level.
Major Support Levels – $242 and $240.
Major Resistance Levels – $248 and $255.
The $100 XRP Dream: Analyst Explains Why It’s A Fantasy
Crypto Insight UK used the first post-cut trading day to reframe the XRP narrative around what he ca...
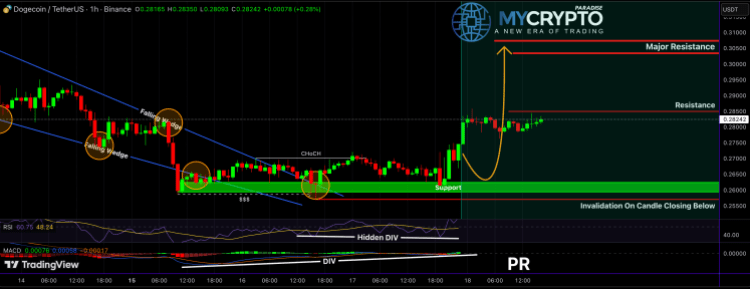
Crypto Analyst Tells Dogecoin Investors To Stay Sharp Amid Historical Bullish Setup
The Dogecoin price had seen an initial run-up to $0.3 before the correction that brought it back tow...
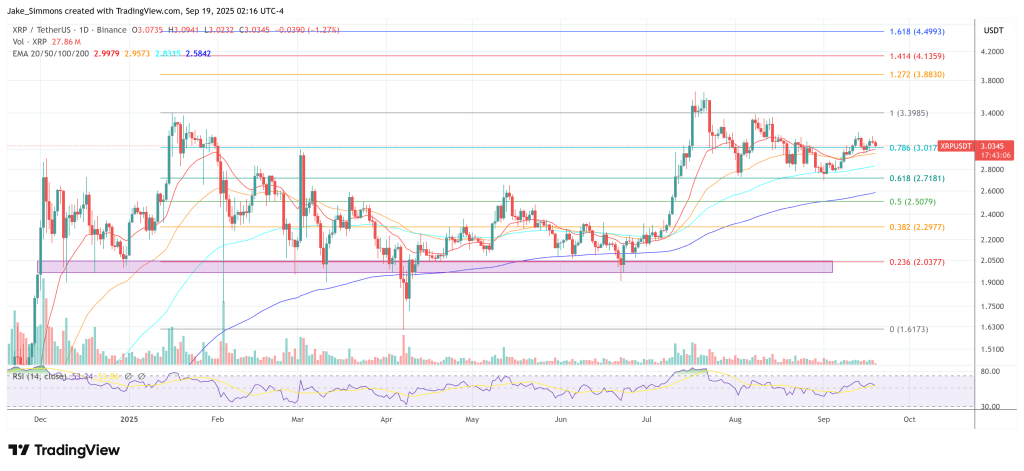
XRP Price Stability Signals Opportunity – Is a Fresh Breakout on the Horizon?
XRP price started a fresh increase above the $3.050 resistance. The price is now correcting some gai...