Bitcoin Price Back at Resistance – Fed Meeting Could Trigger Big Move


Bitcoin price is moving higher above $116,200. BTC is now consolidating and might gain bullish momentum if it clears the $116,850 resistance zone.
- Bitcoin started a fresh increase above the $116,000 zone.
- The price is trading below $116,000 and the 100 hourly Simple moving average.
- There was a break above a contracting triangle with resistance at $115,750 on the hourly chart of the BTC/USD pair (data feed from Kraken).
- The pair might start another increase if it clears the $116,850 zone.
Bitcoin Price Hits Resistance
Bitcoin price started a fresh upward wave above the $114,500 zone. BTC managed to climb above the $115,000 and $115,500 resistance levels.
The bulls were able to push the price above $116,200 and $116,500. Besides, there was a break above a contracting triangle with resistance at $115,750 on the hourly chart of the BTC/USD pair. The price traded as high as $116,959 and is currently consolidating gains. It is stable above the 23.6% Fib retracement level of the recent move from the $114,156 swing low to the $116,959 high.
Bitcoin is now trading above $116,000 and the 100 hourly Simple moving average. Immediate resistance on the upside is near the $116,850 level. The first key resistance is near the $117,200 level.
The next resistance could be $117,500. A close above the $117,500 resistance might send the price further higher. In the stated case, the price could rise and test the $118,400 resistance level. Any more gains might send the price toward the $118,800 level. The next barrier for the bulls could be $119,250.
Another Decline In BTC?
If Bitcoin fails to rise above the $116,850 resistance zone, it could start a fresh decline. Immediate support is near the $116,250 level. The first major support is near the $115,550 level or the 50% Fib retracement level of the recent move from the $114,156 swing low to the $116,959 high.
The next support is now near the $115,200 zone. Any more losses might send the price toward the $114,500 support in the near term. The main support sits at $112,500, below which BTC might decline heavily.
Technical indicators:
Hourly MACD – The MACD is now gaining pace in the bullish zone.
Hourly RSI (Relative Strength Index) – The RSI for BTC/USD is now above the 50 level.
Major Support Levels – $115,550, followed by $115,200.
Major Resistance Levels – $116,850 and $117,200.
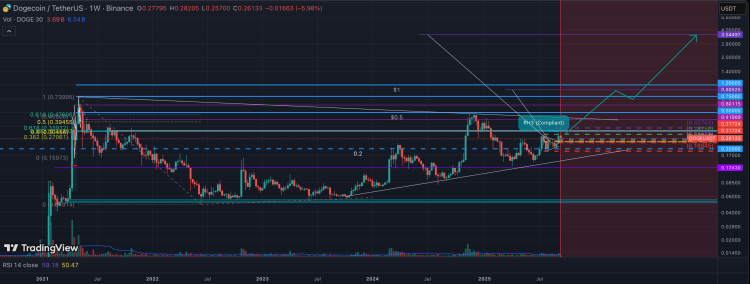
Dogecoin Price Eyes 1,250% Surge To $3.5 – Here’s The Roadmap
The Dogecoin price recorded one of the most notable recoveries over the weekend, rising by more than...
Viral Meme Coin Pudgy Pandas Sparks Maxi Doge Presale to Soar Beyond $2M
A new meme coin from China, Pudgy Pandas ($PANDA), raised over $300K in one day on presale, gaining ...

Citi’s Ethereum Forecast: No New All-Time High Expected, Year-End Target At $4,300
Following an all-time high (ATH) reached last August, Ethereum (ETH), the market’s second-largest cr...