Bitcoin Recovery Builds – Can BTC Turn Momentum Into a Rally?


Bitcoin price is attempting to recover above $112,500. BTC is now consolidating and might rise if it clears the $114,250 resistance zone.
- Bitcoin started a fresh increase above the $113,200 zone.
- The price is trading below $113,000 and the 100 hourly Simple moving average.
- There was a break above a bearish trend line with resistance at $112,300 on the hourly chart of the BTC/USD pair (data feed from Kraken).
- The pair might start another increase if it clears the $114,250 zone.
Bitcoin Price Eyes Recovery
Bitcoin price started a fresh recovery wave from the $110,200 zone. BTC managed to climb above the $111,500 and $112,500 resistance levels.
The bulls were able to push the price above $113,000 and $114,000. Besides, there was a break above a bearish trend line with resistance at $112,300 on the hourly chart of the BTC/USD pair. The pair traded as high as $114,270 and recently started a consolidation phase.
There was a minor decline below $114,000. The price tested the 23.6% Fib retracement level of the recent move from the $110,815 swing low to the $114,270 high.
Bitcoin is now trading above $112,500 and the 100 hourly Simple moving average. Immediate resistance on the upside is near the $114,250 level. The first key resistance is near the $114,500 level. The next resistance could be $115,000. A close above the $115,000 resistance might send the price further higher. In the stated case, the price could rise and test the $115,500 resistance level. Any more gains might send the price toward the $116,200 level. The main target could be $118,000.
Another Decline In BTC?
If Bitcoin fails to rise above the $114,250 resistance zone, it could start a fresh decline. Immediate support is near the $113,500 level. The first major support is near the $112,500 level or the 50% Fib retracement level of the recent move from the $110,815 swing low to the $114,270 high.
The next support is now near the $112,000 zone. Any more losses might send the price toward the $111,500 support in the near term. The main support sits at $110,500, below which BTC might decline sharply.
Technical indicators:
Hourly MACD – The MACD is now gaining pace in the bullish zone.
Hourly RSI (Relative Strength Index) – The RSI for BTC/USD is now above the 50 level.
Major Support Levels – $112,500, followed by $112,000.
Major Resistance Levels – $114,250 and $115,000.

Japan’s Crypto Payment Revolution Begins – Best Wallet Joins the Race
Japan is preparing to launch its first stablecoin credit card. Starting in October 2025, ‘Nudge Card...
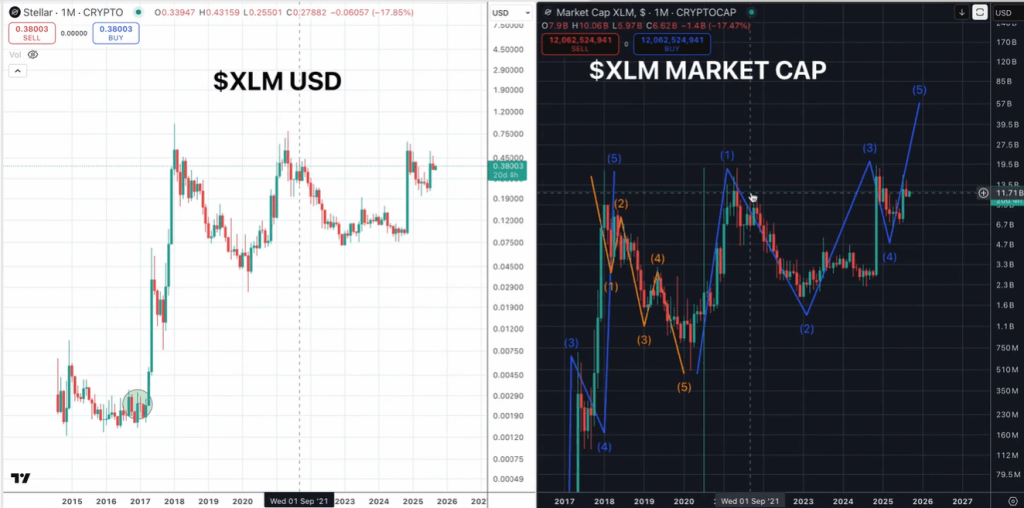
Stellar About To Moon? XLM Price Prediction Calls For 400% Explosion
A new market-cap–based Elliott Wave study from independent chartist Quantum Ascend (@quantum_ascend)...

Bitcoin Jumps Past $114K As Markets Eye Fed Easing After PPI Report
Bitcoin climbed past $114,000 this week, pushing markets higher after a surprisingly weak reading on...