MemeCore Explodes 3,800% For ATH — But Is A Collapse Around The Corner?


MemeCore’s native token M has raced from near-zero to headline-making highs in a matter of weeks, drawing both excitement and sharp warnings from market watchers.
MemeCore’s Meteoric Rise
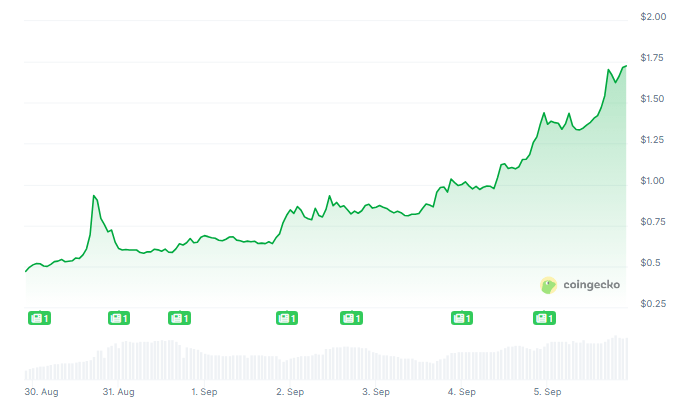
According to reports, M hit a fresh all-time high of $1.69 Friday before easing back to $1.60, while 24-hour volume climbed past $53 million. At the time of writing, M was up 250% in the weekly timeframe , data from Coingecko shows.
That follows July lows near $0.036, a move that translates into roughly a 3,750% gain in about 90 days. Traders piled in quickly. A lot of money followed.
Market Moves Outpaced Fundamentals
Price action has been wild. Momentum indicators show parabolic behavior and the RSI has flashed extreme overbought readings, signaling the run may be stretched.
Based on technicals, the token has swept through resistance levels since mid-August and is trading in territory where a fast reversal is possible.
Some traders say M is being propelled by hype and big marketing plays more than by on-chain usage today.
 Event-Driven Hype And Community Stunts
Reports have disclosed that MemeCore rented Seoul’s Lotte World for the final night of Korea Blockchain Week , an attention-grabbing move that pushed social interest higher.
The project pitches itself as the first Layer-1 built for meme culture and uses a Proof of Meme consensus model alongside community-focused tokenomics.
Those features have been shouted about in the community, and they help explain why momentum traders have shown up in force.
 Bulls Point To Network Story; Bears Point To Liquidity Risk
Supporters highlight the promise of a meme-driven economy as reasons for continued upside. If consolidation holds above $1, a push toward $2 is floated by optimistic traders.
But risks are clear. If $1 support gives way, liquidation cascades could accelerate downside toward $0.40–$0.50. Liquidity outside major centralized exchanges looks thin, and event-driven spikes can reverse quickly.
Memecore Price Forecast And Sentiment SnapshotMeanwhile, based on current projections, MemeCore’s price is predicted to fall by 23% to about $1.19 by October 5, 2025.
Market sentiment is still labeled Bullish by some indicators, while the Fear & Greed Index sits at 48, which is neutral.
Over the past 30 days, M recorded 16/30 green days and roughly 35% price volatility, showing how choppy trading has been.
Those figures suggest a market that favors quick movers but leaves slower traders exposed to steep losses.
Featured image from MemeCore, chart from TradingView

Crypto Bull Run: Probability Of Fed Rate Cuts In September Almost At 100%
Expectations surrounding possible rate cuts by the Federal Reserve in September are nearing peak lev...

‘Corporate’ Altcoin Season? Expert Shares How Crypto ETFs, Treasuries Could Change The Market
Bloomberg Exchange-Traded Fund (ETF) analyst James Seyffart shared his perspective on the long-await...
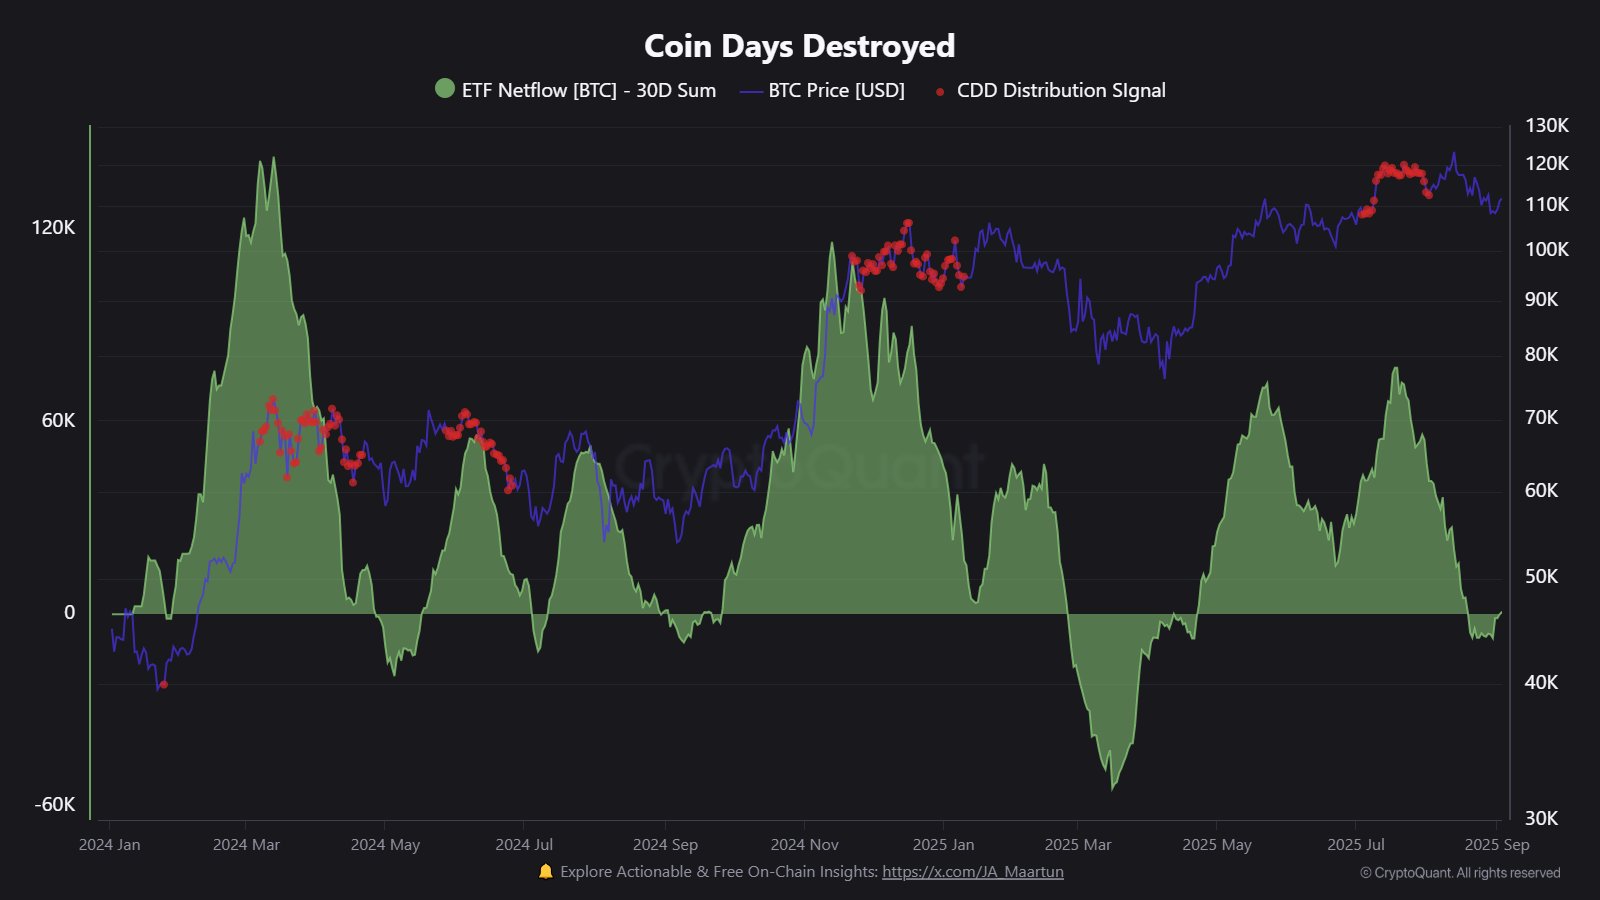
Old Bitcoin Supply Keeps Moving Into ETFs: Data Shows Three Waves So far
On-chain data shows the Bitcoin spot exchange-traded funds (ETFs) have seen three waves of major inf...