Bitcoin STH Cost Basis Aligns With Critical Indicator: Support Builds Around $100K Level


Bitcoin is facing a pivotal moment as it consolidates just above the $110K level after slipping below the $112K support yesterday. Bulls are attempting to hold this level to avoid further downside and to spark a recovery rally. However, many analysts remain cautious, pointing out that momentum has weakened since Bitcoin’s all-time high just over a week ago, with the market now retracing more than 10%.
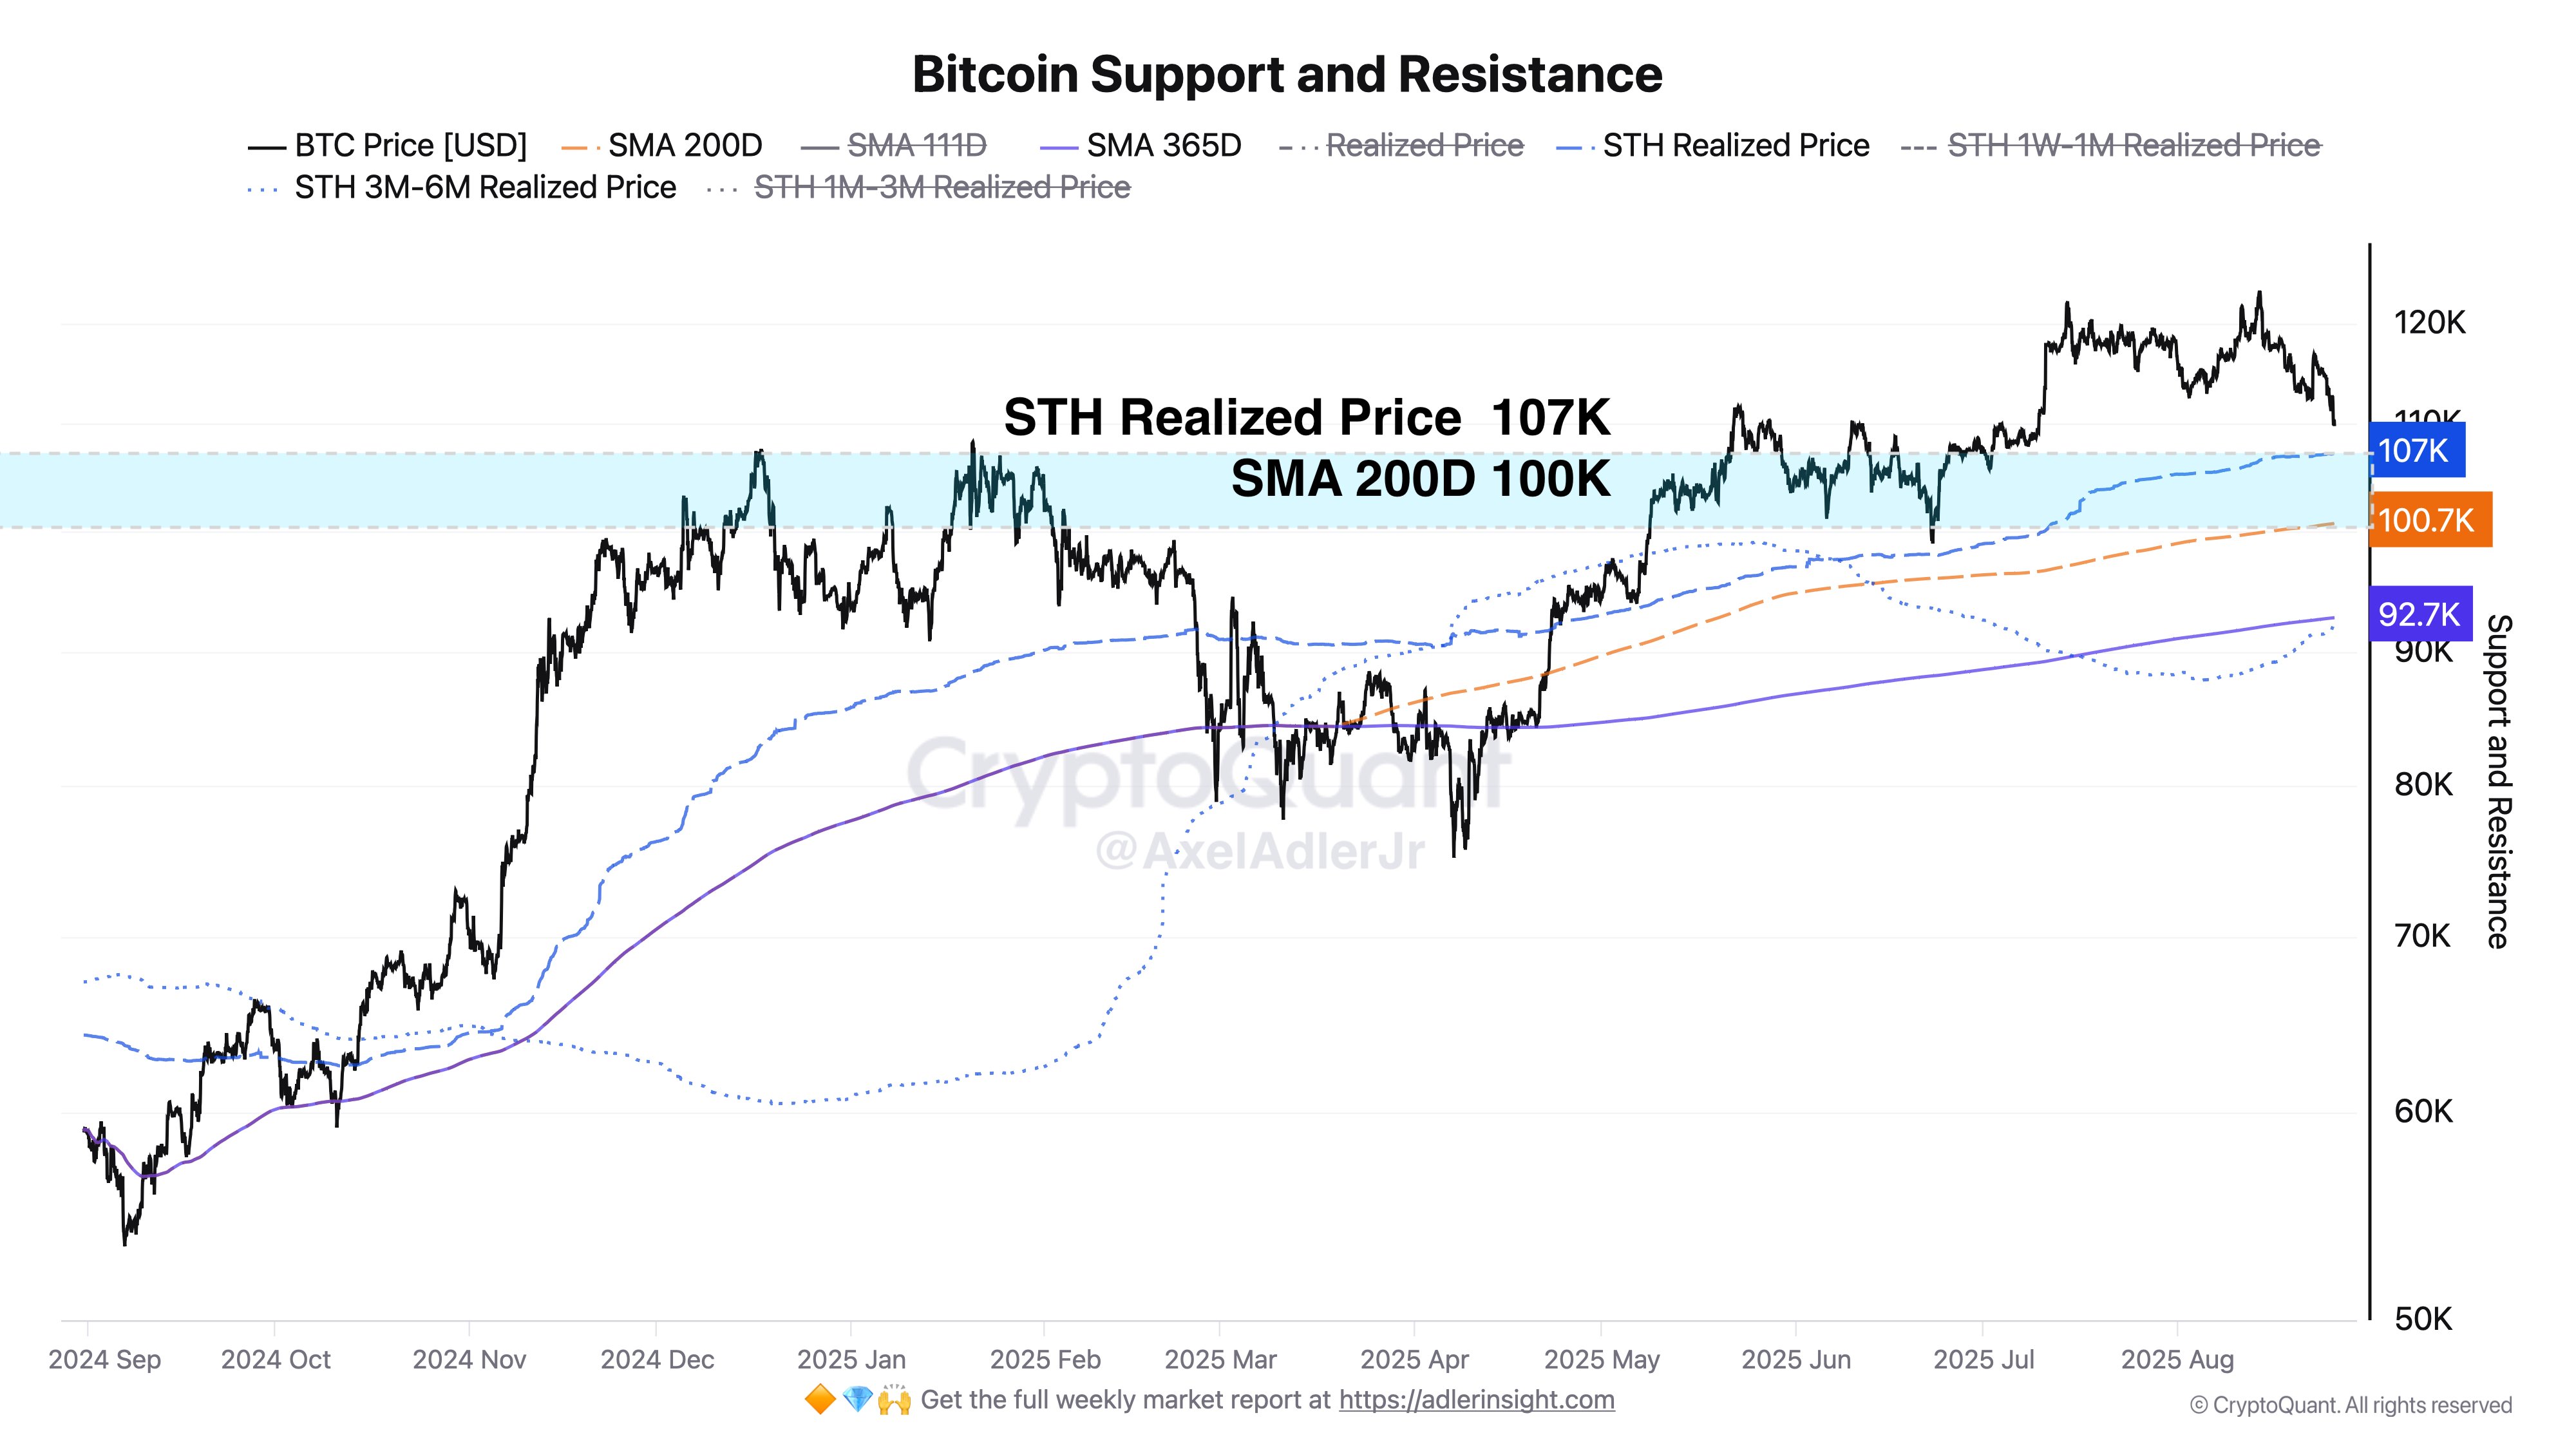
Top analyst Axel Adler shared critical insights, highlighting that the nearest strong support lies within the $100K–$107K range. This zone is particularly important as it represents the confluence of two major indicators: the Short-Term Holder (STH) Realized Price and the 200-day simple moving average (SMA). Historically, these overlapping metrics have acted as strong levels of defense during prior bull cycles, helping Bitcoin maintain its long-term uptrend.
If Bitcoin loses the $110K level decisively, a test of this deeper support band becomes likely. At the same time, sentiment across the market suggests a delicate balance: while fundamentals such as institutional adoption remain strong, short-term traders are increasingly wary of another correction. The coming days will determine whether Bitcoin can defend its structure or risk a broader retracement.
Bitcoin Support Levels: Key Insights
According to Adler, Bitcoin’s current struggle around the $110K zone highlights how crucial strong support levels will be in shaping the next market phase. He points out that if BTC fails to hold the $100K–$107K confluent range , the next significant support lies deeper, around the $92K–$93K region. This zone reflects the cost basis of short-term holders who acquired Bitcoin within the past three to six months. Historically, such levels act as “last defense” areas where buyers step in, as these investors tend to be highly sensitive to price swings.

Adler stresses that losing the $100K–$107K level would likely trigger a sharp reaction in the market, as it not only aligns with the 200-day SMA but also the Short-Term Holder Realized Price. A break below would shift sentiment, possibly leading to panic selling before stability re-emerges near the $92K–$93K area.
Despite these risks, Adler and many other analysts still expect Bitcoin to reclaim momentum in the medium term. They argue that strong fundamentals, ranging from institutional adoption to declining exchange reserves, support the thesis of BTC pushing past all-time highs in the coming months. For now, however, the $100K–$107K range remains the battleground that will decide Bitcoin’s near-term direction.
BTC Price Analysis: Key Levels To Hold
Bitcoin is trading near $110,213 after a sharp retrace, showing signs of struggle as bulls attempt to stabilize the market. The chart highlights a critical test at the 200-day moving average (200D SMA, red line), currently sitting just below the price and acting as the last major dynamic support. This level has historically provided strong protection during corrections, and losing it could trigger deeper declines.

The 50-day (blue) and 100-day (green) SMAs are now turning into resistance levels after being breached in recent sessions. Both indicators cluster in the $111K–$116K range, signaling heavy selling pressure above. The broader structure shows Bitcoin has failed to reclaim the $123K zone, its recent all-time high, and has instead shifted into a consolidation phase marked by lower highs and testing supports.
If BTC loses the $110K zone, the next major support lies in the $100K–$107K range, aligning with Adler’s view that this area represents the STH (short-term holder) realized cost basis and the SMA 200D confluence. On the upside, reclaiming $115K will be the first step for a recovery. For now, Bitcoin remains in a vulnerable but critical zone where the next move will dictate whether bulls can regain control.
Featured image from Dall-E, chart from TradingView

Trump Media And Partners Raise $6 Billion For The First CRO Treasury
The Trump Media & Technology Group (TMTG) announced on Tuesday that it has partnered with the digita...

Bitcoin Keeps Slipping Down: Is $107,000 The Next Support?
On-chain data shows Bitcoin is fast approaching the cost basis of the short-term holders, a retest o...

Dogecoin Gears Up For Triple Surge Vs. Bitcoin – Details
Dogecoin is back in the spotlight after a key technical move against Bitcoin hinted at renewed stren...

