Dogecoin (DOGE) Bears Eye Breakdown Below $0.20 After Steep Correction


Dogecoin started a fresh decline below the $0.220 zone against the US Dollar. DOGE is now consolidating and might dip further below $0.2050.
- DOGE price started a fresh decline below the $0.220 level.
- The price is trading below the $0.2150 level and the 100-hourly simple moving average.
- There is a bearish trend line forming with resistance at $0.2160 on the hourly chart of the DOGE/USD pair (data source from Kraken).
- The price could start a fresh upward move if it stays above the $0.20 zone.
Dogecoin Price Dips Again
Dogecoin price started a fresh decline after there was a close below $0.2320, like Bitcoin and Ethereum . DOGE declined below the $0.220 and $0.2150 support levels.
The price even traded below $0.210. A low was formed at $0.2059 and the price is now consolidating losses. There was a minor recovery wave but the price is still below the 23.6% Fib retracement level of the recent decline from the $0.2672 swing high to the $0.2059 low.
Dogecoin price is now trading below the $0.2150 level and the 100-hourly simple moving average. If there is a recovery wave, immediate resistance on the upside is near the $0.2160 level. There is also a bearish trend line forming with resistance at $0.2160 on the hourly chart of the DOGE/USD pair.
The first major resistance for the bulls could be near the $0.2280 level. The next major resistance is near the $0.2365 level. It is close to the 50% Fib retracement level of the recent decline from the $0.2672 swing high to the $0.2059 low.
A close above the $0.2365 resistance might send the price toward the $0.2450 resistance. Any more gains might send the price toward the $0.250 level. The next major stop for the bulls might be $0.2550.
Another Decline In DOGE?
If DOGE’s price fails to climb above the $0.2160 level, it could continue to move down. Initial support on the downside is near the $0.2060 level. The next major support is near the $0.2020 level.
The main support sits at $0.20. If there is a downside break below the $0.20 support, the price could decline further. In the stated case, the price might slide toward the $0.1880 level or even $0.1820 in the near term.
Technical Indicators
Hourly MACD – The MACD for DOGE/USD is now gaining momentum in the bearish zone.
Hourly RSI (Relative Strength Index) – The RSI for DOGE/USD is now below the 50 level.
Major Support Levels – $0.2000 and $0.1880.
Major Resistance Levels – $0.2160 and $0.2280.
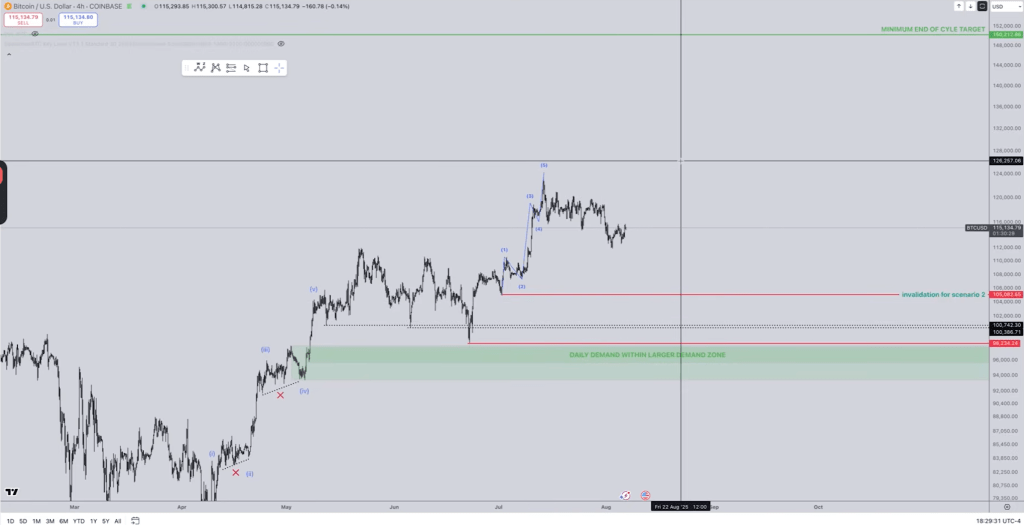
Is $105,000 The Bitcoin Bull Run Killer Or Just Noise? Top Analyst Explains
The question reverberating across —whether a decisive break below $105,000 would end the Bitcoin bul...
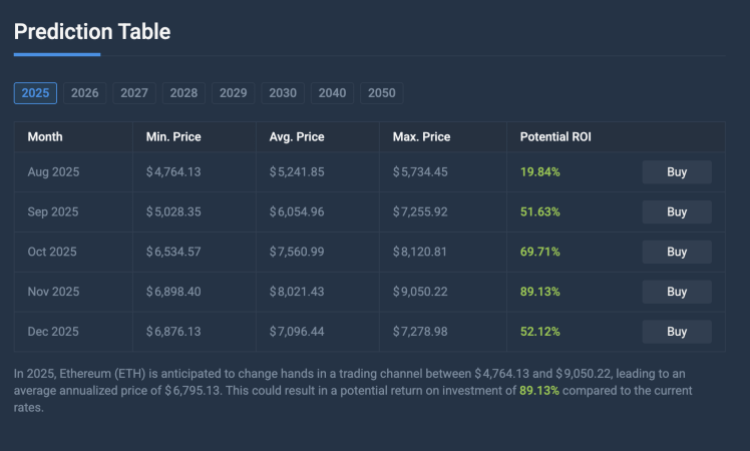
Machine Learning Algorithm Predicts Ethereum Price Will Cross $9,000, Here’s When
After a turbulent four years since the explosive rally of 2021, the Ethereum price looks ready to se...

Chainlink Ready For Massive Breakout? A 15% Drop May Come First
Chainlink (LINK) is retesting a crucial support zone amid the market pullback, leading some analysts...