Bitcoin Price Slips Below $110K, Is a Bigger Drop Coming?


Bitcoin price is gaining bearish momentum below $112,500. BTC is struggling to recover and might continue to move down toward the $105,500 level.
- Bitcoin started a fresh decline below the $112,000 zone.
- The price is trading below $112,000 and the 100 hourly Simple moving average.
- There is a key bearish trend line forming with resistance at $112,500 on the hourly chart of the BTC/USD pair (data feed from Kraken).
- The pair might start another increase if it clears the $112,500 resistance zone.
Bitcoin Price Dips Further
Bitcoin price started a fresh decline after a close below the $113,500 level. BTC gained bearish momentum and traded below the $112,000 support zone.
There was a move below the $110,000 support zone and the 100 hourly Simple moving average . The pair tested the $108,750 zone. A low was formed at $108,734 and the price is now attempting to recover. It climbed above $109,500 but is still below the 23.6% Fib retracement level of the recent decline from the $117,354 swing high to the $110,692 low.
Bitcoin is now trading below $112,000 and the 100 hourly Simple moving average. Immediate resistance on the upside is near the $110,750 level. The first key resistance is near the $112,500 level. There is also a key bearish trend line forming with resistance at $112,500 on the hourly chart of the BTC/USD pair.
The next resistance could be $113,000 or the 50% Fib retracement level of the recent decline from the $117,354 swing high to the $110,692 low. A close above the $113,000 resistance might send the price further higher.
In the stated case, the price could rise and test the $114,500 resistance level. Any more gains might send the price toward the $115,500 level. The main target could be $116,500.
Another Decline In BTC?
If Bitcoin fails to rise above the $112,000 resistance zone, it could start a fresh decline. Immediate support is near the $108,500 level. The first major support is near the $107,200 level.
The next support is now near the $106,500 zone. Any more losses might send the price toward the $105,500 support in the near term. The main support sits at $103,500, below which BTC might accelerate lower.
Technical indicators:
Hourly MACD – The MACD is now gaining pace in the bearish zone.
Hourly RSI (Relative Strength Index) – The RSI for BTC/USD is now below the 50 level.
Major Support Levels – $108,500, followed by $117,200.
Major Resistance Levels – $110,500 and $112,500.
Tether Stays On Top, But These Three Competitors Are Closing In On USDT
The recent passage of the GENIUS Act introduced a new regulatory framework for stablecoins, such as ...
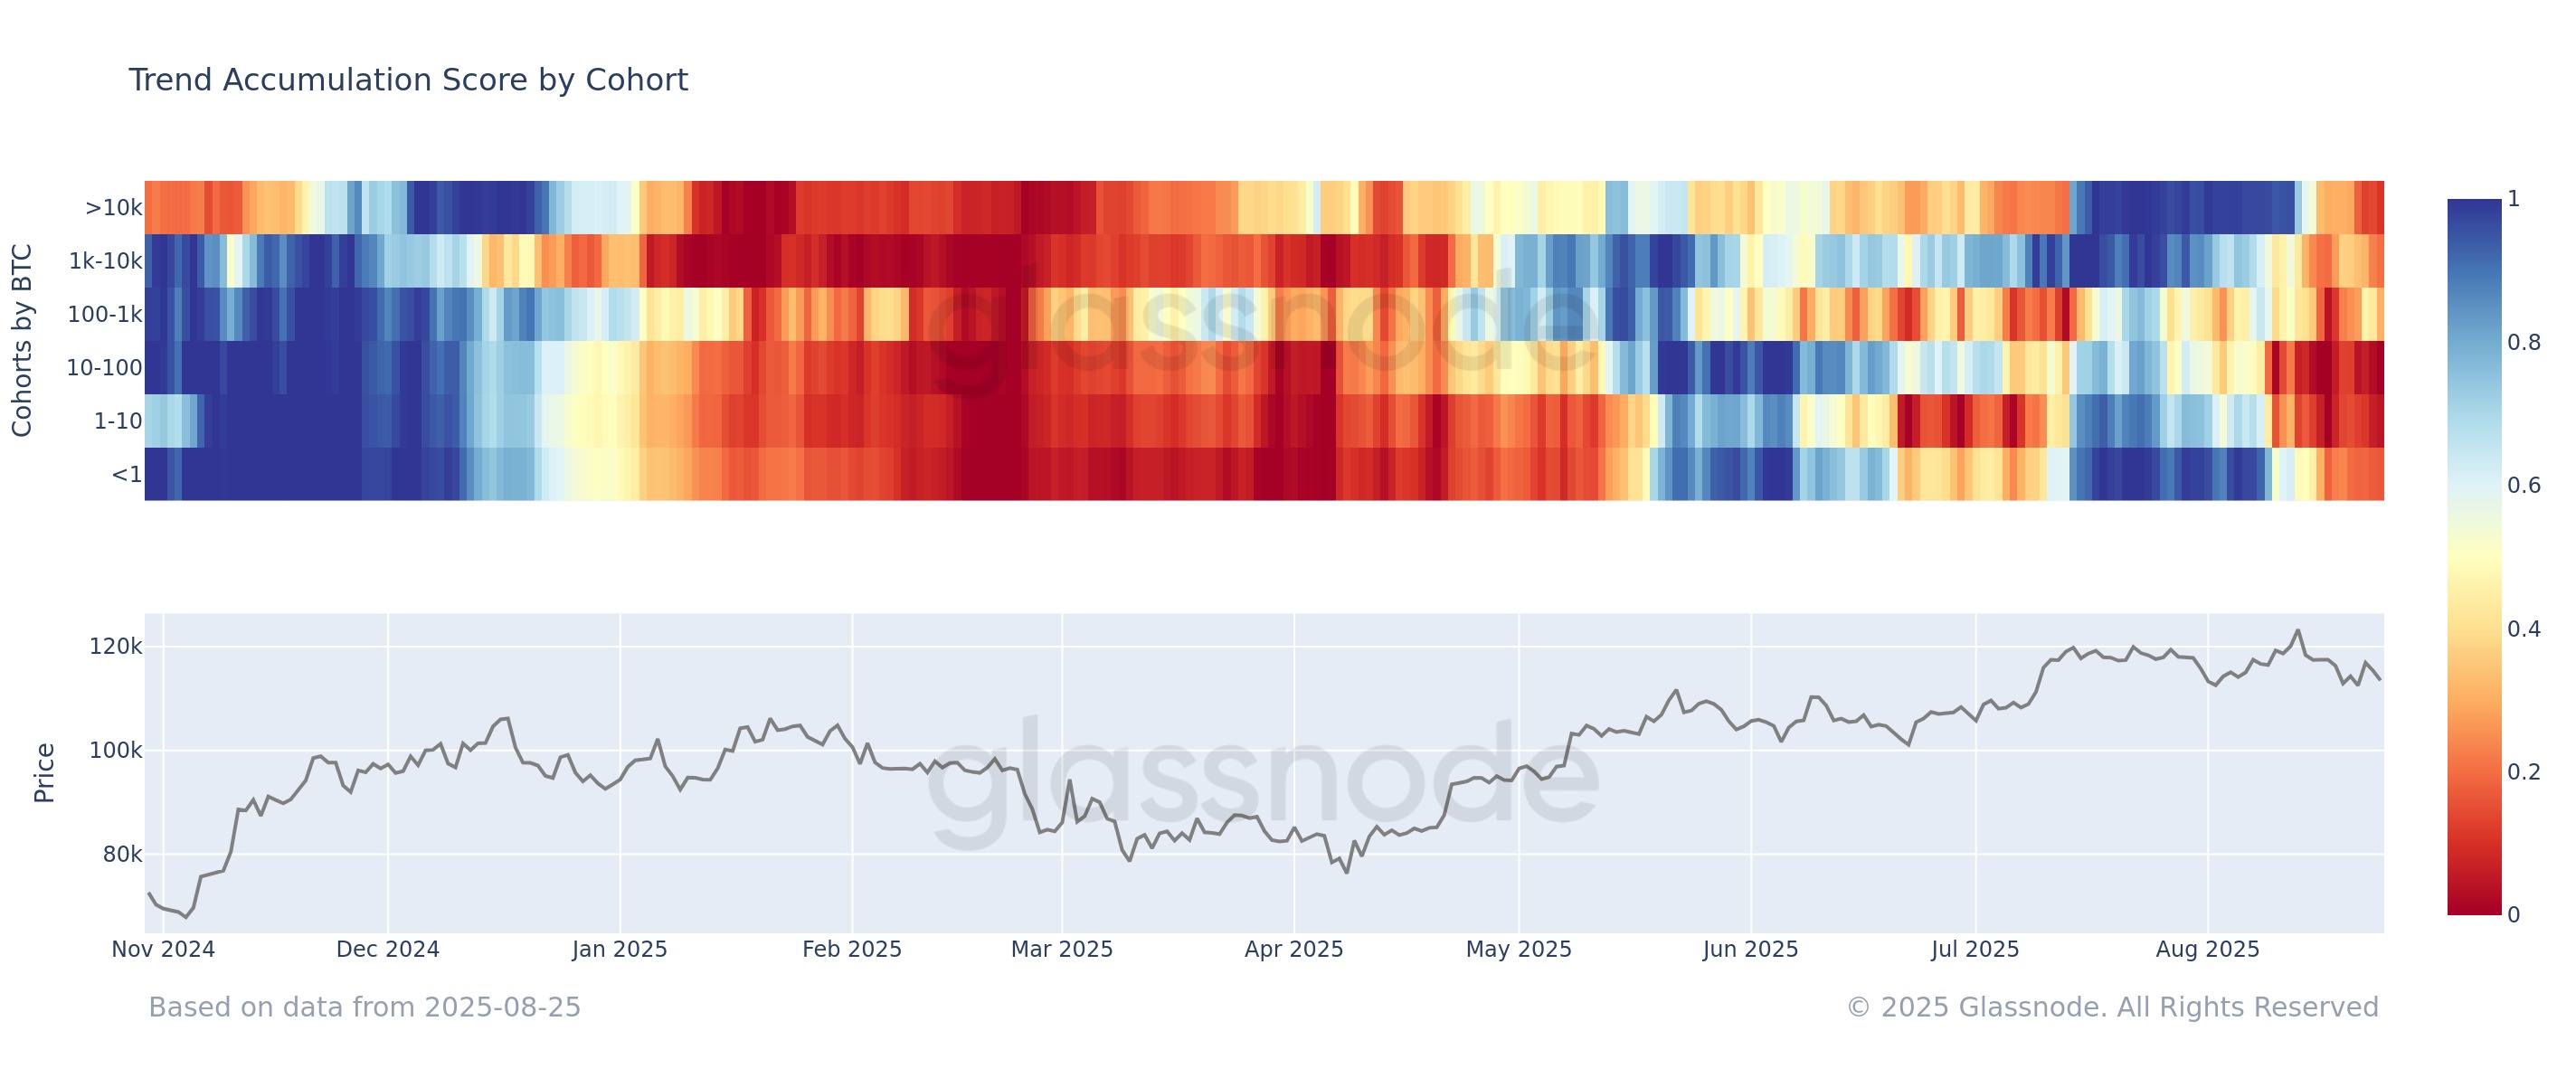
Bitcoin Dives As On-Chain Data Shows Every Cohort Now Selling
On-chain data shows all Bitcoin investor cohorts have pivoted to distribution recently, an indicatio...

What’s Next For Bitcoin? Key Developments After Falling To $112,000
The market’s leading cryptocurrency, Bitcoin (BTC), has recently attempted to stabilize around $112,...