Bitcoin Price Extends Losses, Can Buyers Prevent a Major Breakdown?


Bitcoin price is trimming gains and trading below $120,000. BTC is now showing some bearish signs and might decline below $115,500 zone.
- Bitcoin started a downside correction below the $120,000 zone.
- The price is trading below $118,000 and the 100 hourly Simple moving average.
- There was a break below a key declining channel with support at $116,200 on the hourly chart of the BTC/USD pair (data feed from Kraken).
- The pair might start another increase if it clears the $118,500 resistance zone.
Bitcoin Price Dips Further
Bitcoin price traded to a new all-time high near $124,000 and started a fresh decline. BTC gained bearish momentum and traded below the $120,000 support zone.
There was a move below the $118,500 support zone and the 100 hourly Simple moving average. Besides, there was a break below a key declining channel with support at $116,200 on the hourly chart of the BTC/USD pair. The pair tested the $115,800 zone.
It is now consolidating losses below the 23.6% Fib retracement level of the recent decline from the $124,420 swing high to the $115,800 low. Bitcoin is now trading below $118,000 and the 100 hourly Simple moving average .
Immediate resistance on the upside is near the $116,850 level. The first key resistance is near the $118,000 level. The next resistance could be $118,500. A close above the $118,500 resistance might send the price further higher.
In the stated case, the price could rise and test the $119,200 resistance level. Any more gains might send the price toward the $120,000 level or the 50% Fib retracement level of the recent decline move from the $124,420 swing high to the $115,800 low. The main target could be $121,500.
More Losses In BTC?
If Bitcoin fails to rise above the $118,000 resistance zone, it could start a fresh decline. Immediate support is near the $115,800 level. The first major support is near the $115,000 level.
The next support is now near the $113,500 zone. Any more losses might send the price toward the $112,500 support in the near term. The main support sits at $110,000, below which BTC might continue to move down.
Technical indicators:
Hourly MACD – The MACD is now gaining pace in the bearish zone.
Hourly RSI (Relative Strength Index) – The RSI for BTC/USD is now below the 50 level.
Major Support Levels – $115,800, followed by $115,000.
Major Resistance Levels – $118,000 and $118,500.
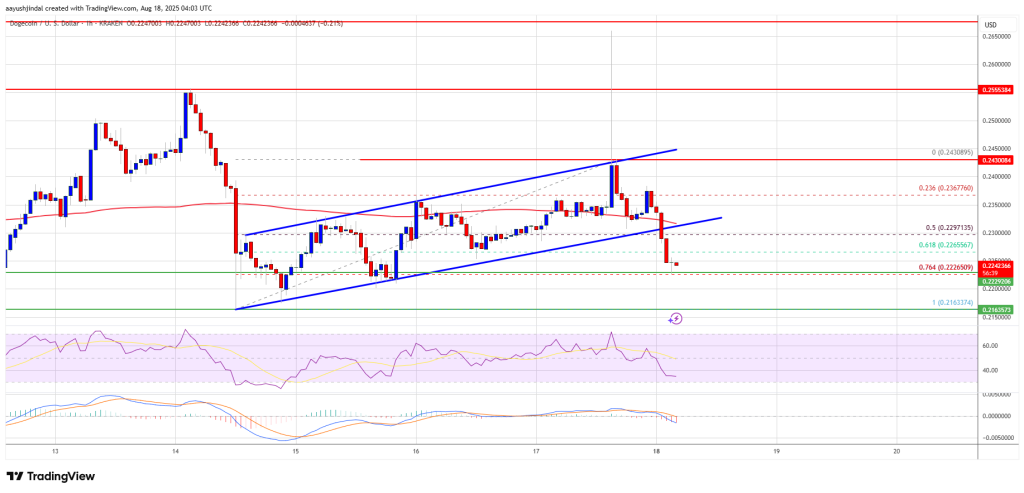
Dogecoin (DOGE) Battles Gravity, Can It Escape a Potential Freefall?
Dogecoin started a fresh decline below the $0.250 zone against the US Dollar. DOGE is now consolidat...
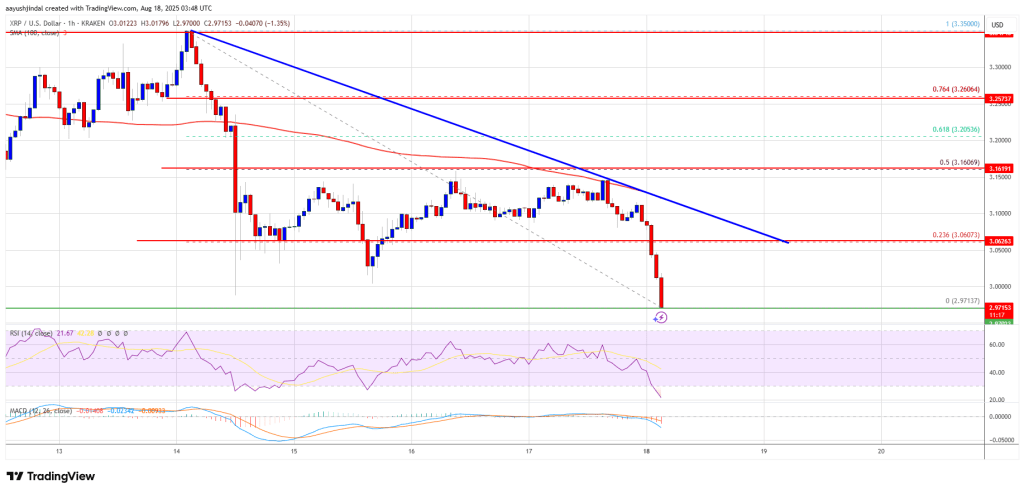
XRP Bears Push Lower, Can Bulls Maintain Control Near $3?
XRP price is gaining bearish pace below the $3.150 resistance zone. The price is struggling near $3....
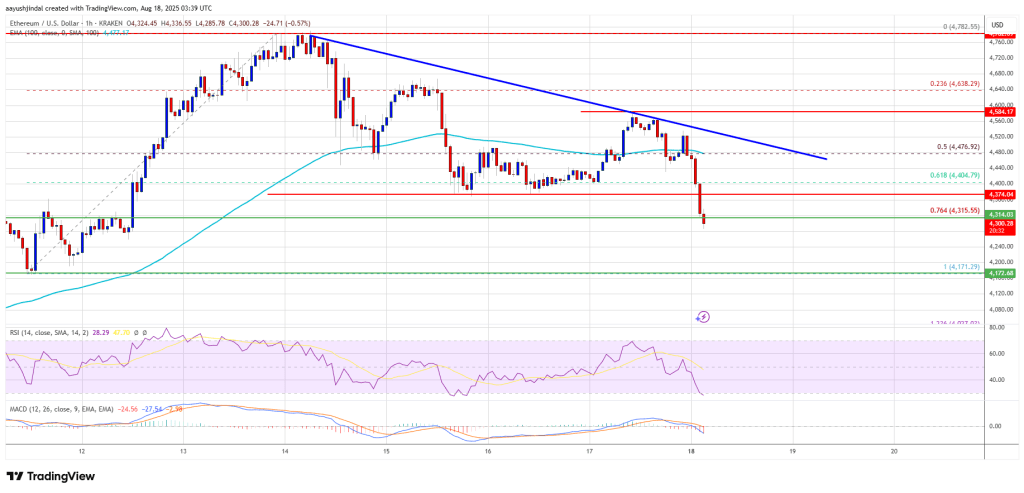
Ethereum Price Pulls Back Again, Will Buyers Step In at Critical Levels?
Ethereum price started a downside correction below the $4,650 zone. ETH is showing some bearish sign...