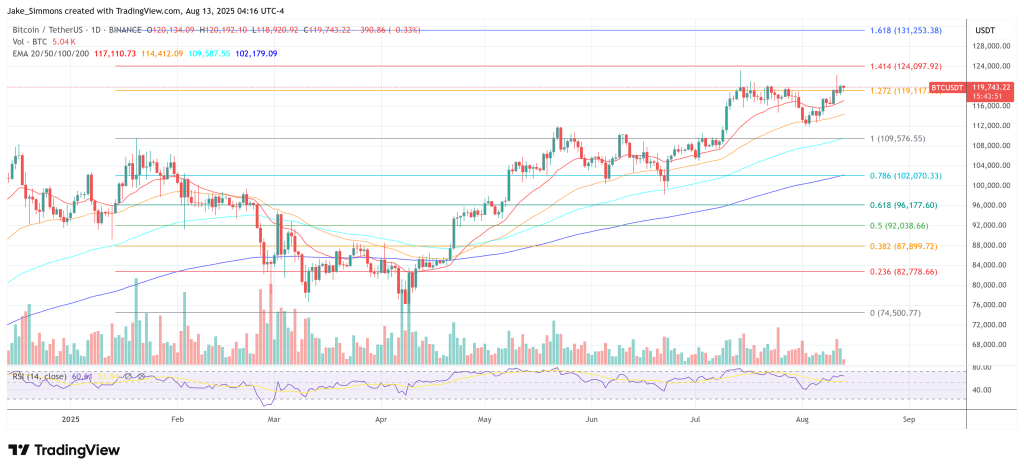
Bitcoin Price Trades Sideways Under $120K—Will Bulls Regain Control?


Bitcoin price is correcting gains below the $121,200 zone. BTC is now consolidating and might aim for a move above the $120,500 resistance zone.
- Bitcoin started a downside correction below the $121,200 zone.
- The price is trading above $118,000 and the 100 hourly Simple moving average.
- There is a bullish trend line forming with support at $118,600 on the hourly chart of the BTC/USD pair (data feed from Kraken).
- The pair might start another increase if it clears the $120,250 resistance zone.
Bitcoin Price Holds Key Support
Bitcoin price failed to extend gains above $122,250 and started a downside correction . BTC corrected gains and traded below the $121,200 support zone.
There was a move below the $120,500 level. The price dipped below the 50% Fib retracement level of the upward move from the $116,282 swing low to the $122,272 high. Finally, the price spiked below the $118,500 support and tested the 100 hourly Simple moving average.
Bitcoin is now trading above $118,000 and the 100 hourly Simple moving average . There is also a bullish trend line forming with support at $118,600 on the hourly chart of the BTC/USD pair.
Immediate resistance on the upside is near the $120,000 level. The first key resistance is near the $120,250 level. The next resistance could be $120,850. A close above the $120,850 resistance might send the price further higher. In the stated case, the price could rise and test the $122,250 resistance level. Any more gains might send the price toward the $124,000 level. The main target could be $125,000.
More Losses In BTC?
If Bitcoin fails to rise above the $120,500 resistance zone, it could start another decline. Immediate support is near the $118,600 level or the 61.8% Fib retracement level of the upward move from the $116,282 swing low to the $122,272 high. The first major support is near the $117,800 level.
The next support is now near the $116,550 zone. Any more losses might send the price toward the $115,500 support in the near term. The main support sits at $113,500, below which BTC might continue to move down.
Technical indicators:
Hourly MACD – The MACD is now losing pace in the bullish zone.
Hourly RSI (Relative Strength Index) – The RSI for BTC/USD is now below the 50 level.
Major Support Levels – $118,600, followed by $117,800.
Major Resistance Levels – $120,250 and $120,850.

How Western Union’s Acquisition Of Intermex Is A Win For Ripple And XRP
Global financial services company Western Union’s acquisition of International Money Express, Inc. (...
Two Forces Can Launch Bitcoin To $1 Million, Says Mike Novogratz
Mike Novogratz believes Bitcoin’s path to $1 million is powered by two engines—grassroots adoption a...
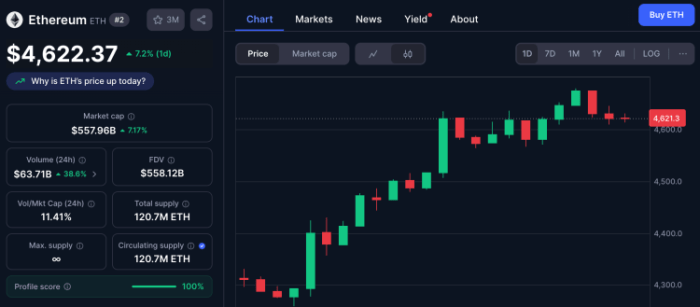
Best Altcoins to 10x After Ethereum’s $4.5K Breakout and $265K Whale Moves
Investors woke up yesterday to some serious on-chain fireworks. Whales snapped up a staggering $161K...