Solana (SOL) Coils for Upside Move – Will Resistance Give Way?


Solana started a fresh increase above the $162 zone. SOL price is now consolidating gains and might aim for more gains above the $172 zone.
- SOL price started a fresh upward move above the $160 and $162 levels against the US Dollar.
- The price is now trading above $162 and the 100-hourly simple moving average.
- There is a key bullish trend line forming with support at $165 on the hourly chart of the SOL/USD pair (data source from Kraken).
- The pair could start a fresh increase if it clears the $172 resistance zone.
Solana Price Eyes Fresh Move To $180
Solana price started a decent increase after it found support near the $155 zone, like Bitcoin and Ethereum . SOL climbed above the $160 level to enter a short-term positive zone.
The price even smashed the $162 resistance. The bulls were able to push the price above the 23.6% Fib retracement level of the downward move from the $182 swing high to the $155 low. There is also a key bullish trend line forming with support at $165 on the hourly chart of the SOL/USD pair.
Solana is now trading above $162 and the 100-hourly simple moving average. On the upside, the price is facing resistance near the $170 level. It is close to the 50% Fib retracement level of the downward move from the $182 swing high to the $155 low.
The next major resistance is near the $172 level. The main resistance could be $180. A successful close above the $180 resistance zone could set the pace for another steady increase. The next key resistance is $182. Any more gains might send the price toward the $192 level.
Are Downsides Supported In SOL?
If SOL fails to rise above the $172 resistance, it could start another decline. Initial support on the downside is near the $165 zone and the trend line. The first major support is near the $162 level.
A break below the $162 level might send the price toward the $155 support zone. If there is a close below the $150 support, the price could decline toward the $145 support in the near term.
Technical Indicators
Hourly MACD – The MACD for SOL/USD is gaining pace in the bullish zone.
Hourly Hours RSI (Relative Strength Index) – The RSI for SOL/USD is above the 50 level.
Major Support Levels – $165 and $162.
Major Resistance Levels – $172 and $182.
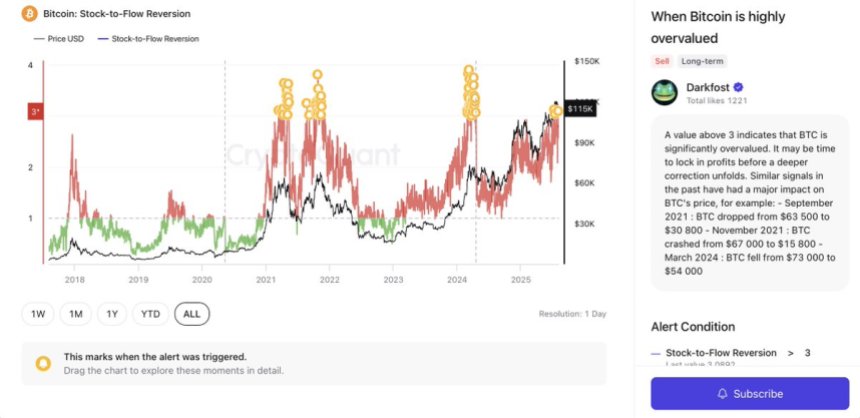
Is Bitcoin Overheated? Key Signal Flashes Warning Similar To 2021 And 2024 Market Tops
Bitcoin is undergoing a sharp correction after losing the $115K support level, triggering a wave of ...
Market Expert Debunks Possible Bitcoin Top In November Using 9-12 Months Retail Cycle
The debate around Bitcoin’s top for this cycle has been a major topic as market participants eye pot...

Shiba Inu Team Member Reveals ‘Primary Challenge’ And ‘Top Priority’ Amid Market Uncertainty
In the face of growing market uncertainty, a Shiba Inu developer, Kaal Dhairya, has spoken out on X ...