Following another XRP bullish moving average crossover, a market analyst has presented two possible price targets, citing historical context.
This
commentary
, which came from EGRAG Crypto, emerges as XRP sustains its gains from the recent market-wide upsurge.
Despite the previous 580% rise from November 2024 to January 2025 and the latest 55% increase this month, EGRAG believes XRP still has one more upward push in the current bull run. He noted that from historical price movements, the 21-week and 33-week SMAs typically record two bullish crosses.
XRP's Bullish SMA Crosses
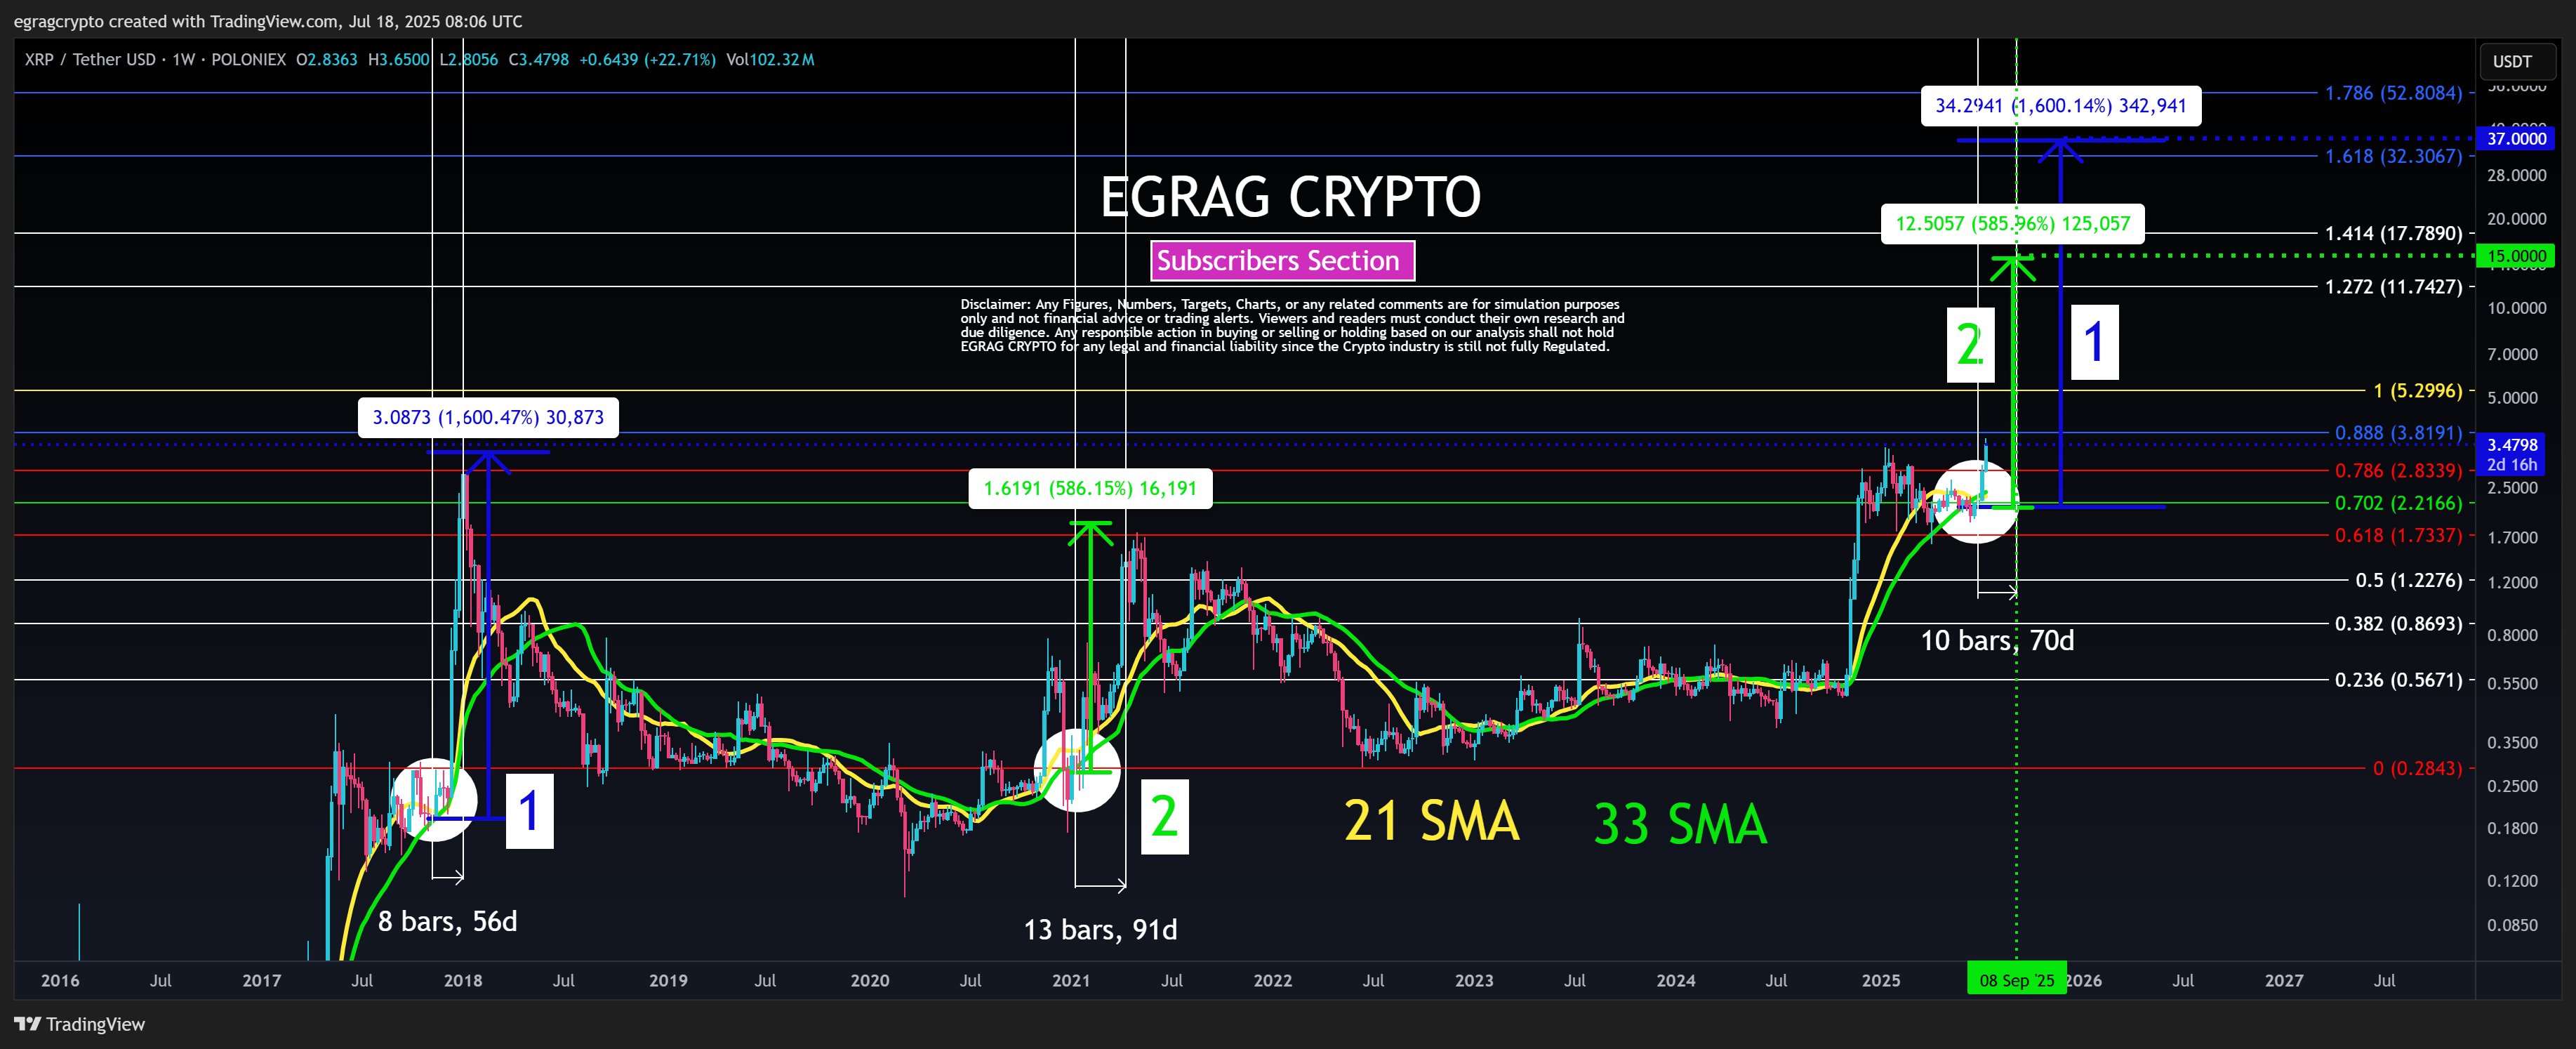
Such a bullish cross occurs when the 21 SMA (the shorter moving average) moves above the 33 SMA (the longer moving average). According to EGRAG's chart, this pattern played out over the past two cycles and resulted in impressive price gains for XRP.
For instance, during the 2017/2018 cycle, the 21 SMA initially moved above the 33 SMA in March 2017, marking the first bullish cross. Following this event, XRP's price skyrocketed, soaring from around $0.005 to a new peak of $0.3988 before cooling. After the $0.3988 top, a pullback and consolidation emerged.
Interestingly, during the consolidation phase, the 21 SMA dropped to briefly retest the 33 SMA. However, another bullish cross occurred around November 2017 after this retest. Following the cross,
XRP
again surged. Specifically, it took XRP eight weekly bars or 52 days to hit its 2017 cycle top of $3.8.
Meanwhile, in the 2020/2021 cycle, a similar pattern occurred. According to data from EGRAG's chart, the bullish cross materialized in January 2021 during this cycle, leading to an XRP uptrend. The uptrend took about 13 weekly bars or 91 days to reach the cycle top of $1.96 in April 2021.
XRP Cycle Top as XRP Now Seeing a Second Bullish Cross
Now, in the current cycle, XRP first saw a bullish cross in November 2024,
leading to the initial 580% surge
to $3.4 before the pullback and subsequent consolidation. With XRP now recovering from this consolidation, EGRAG confirmed that a second bullish cross has emerged.
XRP 1W Chart | EGRAG Crypto
The market analyst suggested that this second cross marks the beginning of the end of the current bull run, as it would lead to XRP's second leg up. He pointed out that the average duration it took for both cycles to reach their respective tops is 73 days. As a result, he believes this could be the timeline for XRP to hit its top for this cycle.
For context, this 73-day duration leads to early September. As a result, EGRAG suggested that he expects XRP to reach its cycle top in the first or second week of September.
XRP Cycle Top Price Targets
Meanwhile, regarding the price, EGRAG has two targets, drawing inspiration from the last two cycles. Notably, in the 2017/2018 cycle, XRP rallied 1,600% to $3.8. If a similar run occurred now, it could hit $37. However, in the 2020/2021 cycle, XRP surged 585% to $1.96. If it replicates this instead,
the top for this cycle will be $15
.
Disclaimer: This article is copyrighted by the original author and does not represent MyToken’s views and positions. If you have any questions regarding content or copyright, please contact us.(www.mytokencap.com)contact