Dogecoin (DOGE) Bounces Off Lows, But $0.180 Cap Remains A Challenge


Dogecoin started a fresh increase above the $0.1650 zone against the US Dollar. DOGE is now consolidating and might aim for a move above $0.1720.
- DOGE price started a fresh increase above the $0.1620 and $0.1650 levels.
- The price is trading above the $0.1650 level and the 100-hourly simple moving average.
- There was a break above a key bearish trend line with resistance at $0.1640 on the hourly chart of the DOGE/USD pair (data source from Kraken).
- The price could start a fresh decline if it stays below the $0.1720 zone and $0.1800.
Dogecoin Price Faces Hurdles
Dogecoin price started a fresh increase from the $0.1565 zone, like Bitcoin and Ethereum . DOGE was able to climb above the $0.1600 and $0.1620 resistance levels.
The bulls even pushed the price above the $0.170 resistance. Besides, there was a break above a key bearish trend line with resistance at $0.1640 on the hourly chart of the DOGE/USD pair. A high was formed at $0.1726 and the price is now consolidating gains. There was a minor decline below the 23.6% Fib retracement level of the upward move from the $0.1565 swing low to the $0.1726 high.
Dogecoin price is now trading above the $0.1650 level and the 100-hourly simple moving average. Immediate resistance on the upside is near the $0.1710 level. The first major resistance for the bulls could be near the $0.1720 level.
The next major resistance is near the $0.1750 level. A close above the $0.1750 resistance might send the price toward the $0.180 resistance. Any more gains might send the price toward the $0.200 level. The next major stop for the bulls might be $0.2120.
Another Decline In DOGE?
If DOGE’s price fails to climb above the $0.1720 level, it could start another decline. Initial support on the downside is near the $0.1650 level or the 50% Fib retracement level of the upward move from the $0.1565 swing low to the $0.1726 high. The next major support is near the $0.1620 level.
The main support sits at $0.1560. If there is a downside break below the $0.1560 support, the price could decline further. In the stated case, the price might decline toward the $0.150 level or even $0.1450 in the near term.
Technical Indicators
Hourly MACD – The MACD for DOGE/USD is now losing momentum in the bullish zone.
Hourly RSI (Relative Strength Index) – The RSI for DOGE/USD is now above the 50 level.
Major Support Levels – $0.1650 and $0.1620.
Major Resistance Levels – $0.1720 and $0.1800.
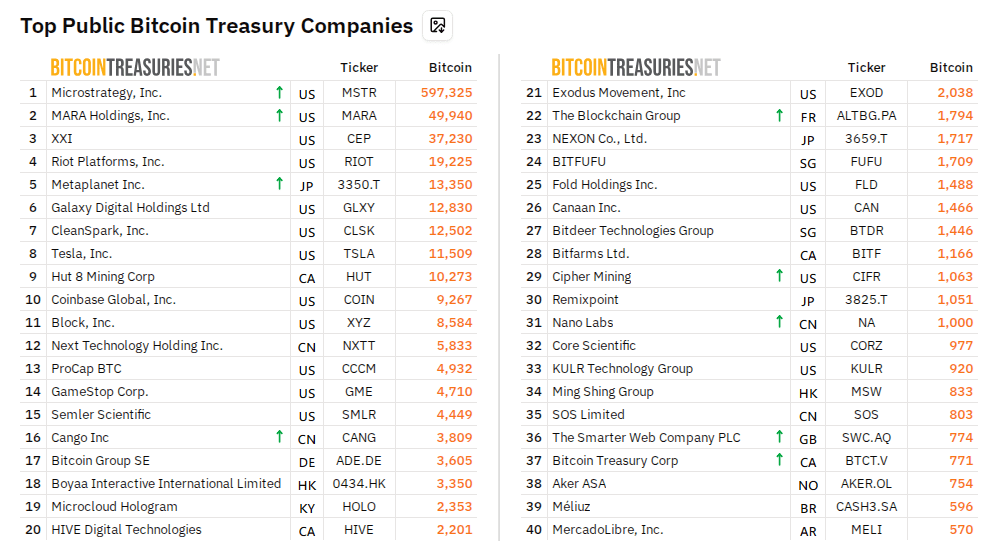
The Silent Bitcoin Accumulation: Public Companies’ Surprising H1 2025 Lead
According to recent data, public companies have raced ahead of Bitcoin spot ETF issuers by snapping ...
Buy Bitcoin Before Jackson Hole—Or Regret It Forever, Says Arthur Hayes
Arthur Hayes has published a new essay, “Quid Pro Stablecoin,” arguing that the United States’ sudde...
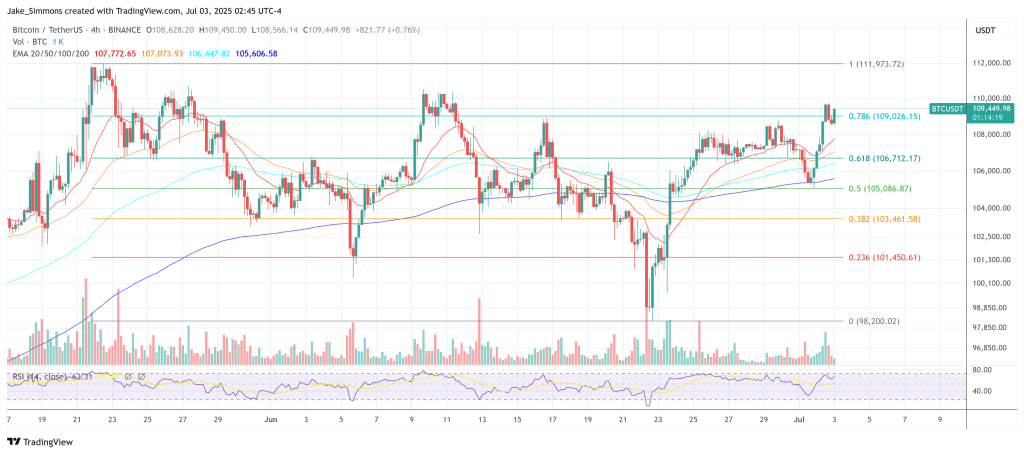
Bitcoin Moves Up, Dogecoin Surges Above Key $0.17 Mark; Token6900 Set to Explode
Bitcoin climbed above $109K, triggering a surge across the markets: Ethereum ($ETH) – up 4.65% XRP (...