XRP Price Moves Up — Hurdles Ahead Could Limit Gains


XRP price started a decent upward move from the $2.150 zone. The price is now consolidating gains and might face hurdles near the $2.285 zone.
- XRP price started a fresh increase above the $2.220 zone.
- The price is now trading above $2.220 and the 100-hourly Simple Moving Average.
- There is a key bullish trend line forming with support at $2.20 on the hourly chart of the XRP/USD pair (data source from Kraken).
- The pair could start another decline if it fails to clear the $2.2850 resistance zone.
XRP Price Restarts Increase
XRP price found support near the $2.150 level and started a fresh increase, like Bitcoin and Ethereum . The price was able to recover losses and climbed above the $2.220 resistance level.
The bulls were able to push the price above the $2.250 level. There was a spike above the 61.8% Fib retracement level of the downward move from the $2.327 swing high to the $2.148 low. However, the bears were active near the $2.2850 level.
The price failed to surpass the 76.4% Fib retracement level of the downward move from the $2.327 swing high to the $2.148 low. The price is now trading above $2.220 and the 100-hourly Simple Moving Average. Besides, there is a key bullish trend line forming with support at $2.20 on the hourly chart of the XRP/USD pair.
On the upside, the price might face resistance near the $2.2580 level. The first major resistance is near the $2.2850 level. The next resistance is $2.320. A clear move above the $2.320 resistance might send the price toward the $2.350 resistance. Any more gains might send the price toward the $2.40 resistance or even $2.420 in the near term. The next major hurdle for the bulls might be $2.50.
Fresh Decline?
If XRP fails to clear the $2.2850 resistance zone, it could start another decline. Initial support on the downside is near the $2.220 level. The next major support is near the $2.20 level and the trend line.
If there is a downside break and a close below the $2.20 level, the price might continue to decline toward the $2.150 support. The next major support sits near the $2.120 zone.
Technical Indicators
Hourly MACD – The MACD for XRP/USD is now losing pace in the bullish zone.
Hourly RSI (Relative Strength Index) – The RSI for XRP/USD is now above the 50 level.
Major Support Levels – $2.220 and $2.20.
Major Resistance Levels – $2.2850 and $2.320.
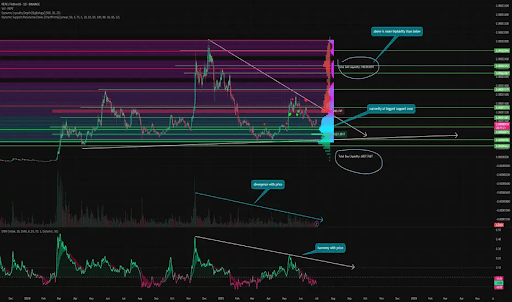
PEPE Eyes 150% Jump To Grab Liquidity At $0.000025 After Bouncing Off ‘Powerful Support’
Crypto analyst Crypto Inside has provided a bullish outlook for the PEPE meme coin. The analyst pred...
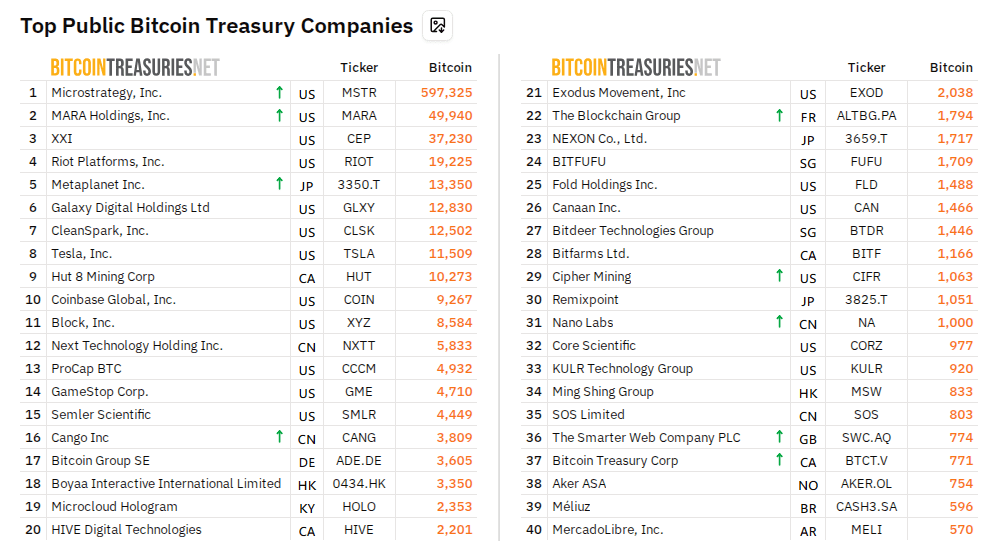
The Silent Bitcoin Accumulation: Public Companies’ Surprising H1 2025 Lead
According to recent data, public companies have raced ahead of Bitcoin spot ETF issuers by snapping ...
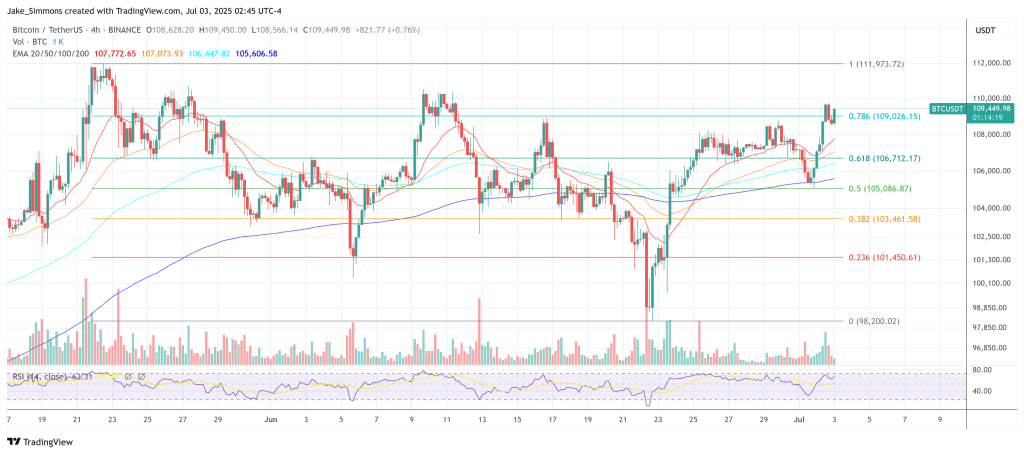
Buy Bitcoin Before Jackson Hole—Or Regret It Forever, Says Arthur Hayes
Arthur Hayes has published a new essay, “Quid Pro Stablecoin,” arguing that the United States’ sudde...