Solana (SOL) at Crossroads — Bounce Likely If $142 Remains Intact


Solana started a fresh decline and retested the $145 support zone. SOL price is now recovering and might aim for a fresh increase above the $150 zone.
- SOL price started a fresh decline after it failed to clear $160 against the US Dollar.
- The price is now trading below $150 and the 100-hourly simple moving average.
- There was a break above a key bearish trend line with resistance at $147 on the hourly chart of the SOL/USD pair (data source from Kraken).
- The pair could start a fresh increase if it clears the $152 resistance zone.
Solana Price Trims Gains
Solana price struggled to continue higher above $160 and started a fresh decline, like Bitcoin and Ethereum . SOL declined below the $155 and $152 support levels.
It even dipped below $150 and tested the $145 zone. A low was formed at $144 and the price is now correcting some losses. There was a move above the 23.6% Fib retracement level of the downward move from the $160 swing high to the $144 low.
Besides, there was a break above a key bearish trend line with resistance at $147 on the hourly chart of the SOL/USD pair. Solana is now trading below $150 and the 100-hourly simple moving average.
On the upside, the price is facing resistance near the $150 level. The next major resistance is near the $152 level. It is close to the 50% Fib retracement level of the downward move from the $160 swing high to the $144 low. The main resistance could be $155. A successful close above the $155 resistance zone could set the pace for another steady increase. The next key resistance is $160. Any more gains might send the price toward the $165 level.
Another Decline in SOL?
If SOL fails to rise above the $150 resistance, it could start another decline. Initial support on the downside is near the $145 zone. The first major support is near the $142 level.
A break below the $142 level might send the price toward the $136 zone. If there is a close below the $136 support, the price could decline toward the $125 support in the near term.
Technical Indicators
Hourly MACD – The MACD for SOL/USD is losing pace in the bearish zone.
Hourly Hours RSI (Relative Strength Index) – The RSI for SOL/USD is above the 50 level.
Major Support Levels – $145 and $142.
Major Resistance Levels – $152 and $155.
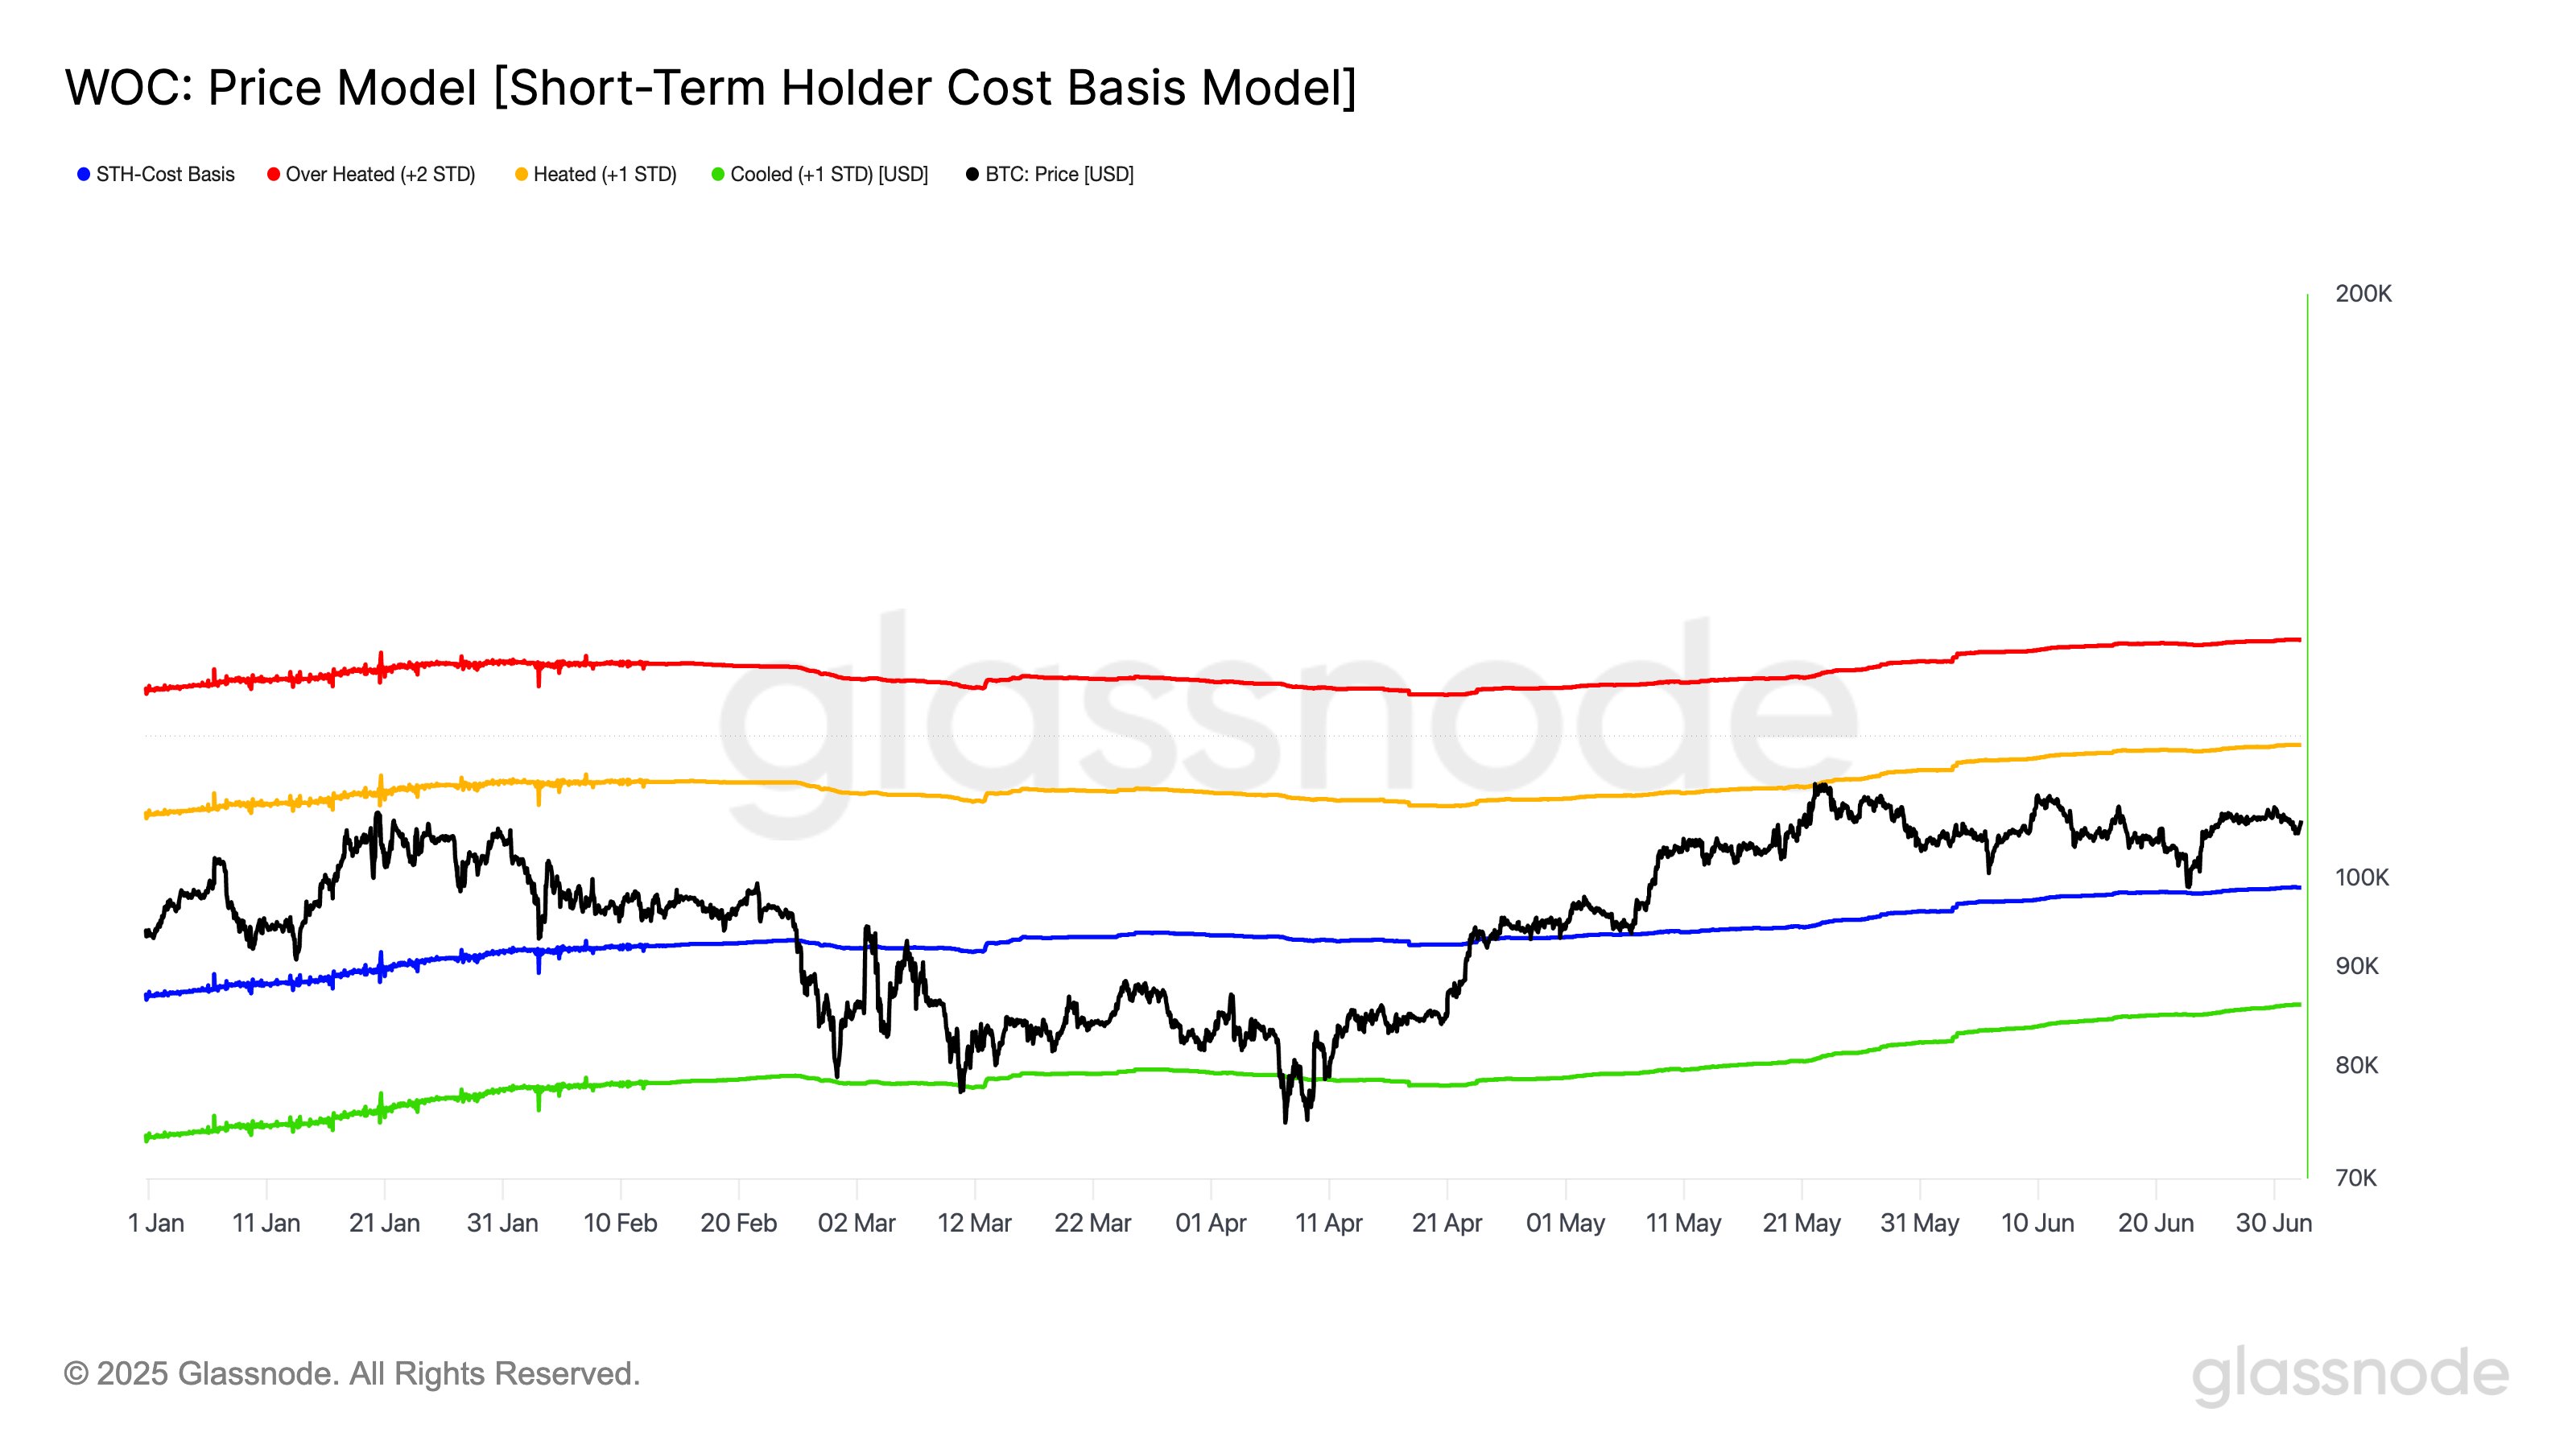
Bitcoin Short-Term Upper Bound Is $117,000, Glassnode Says
The on-chain analytics firm Glassnode has revealed Bitcoin has recently been trading within a short-...
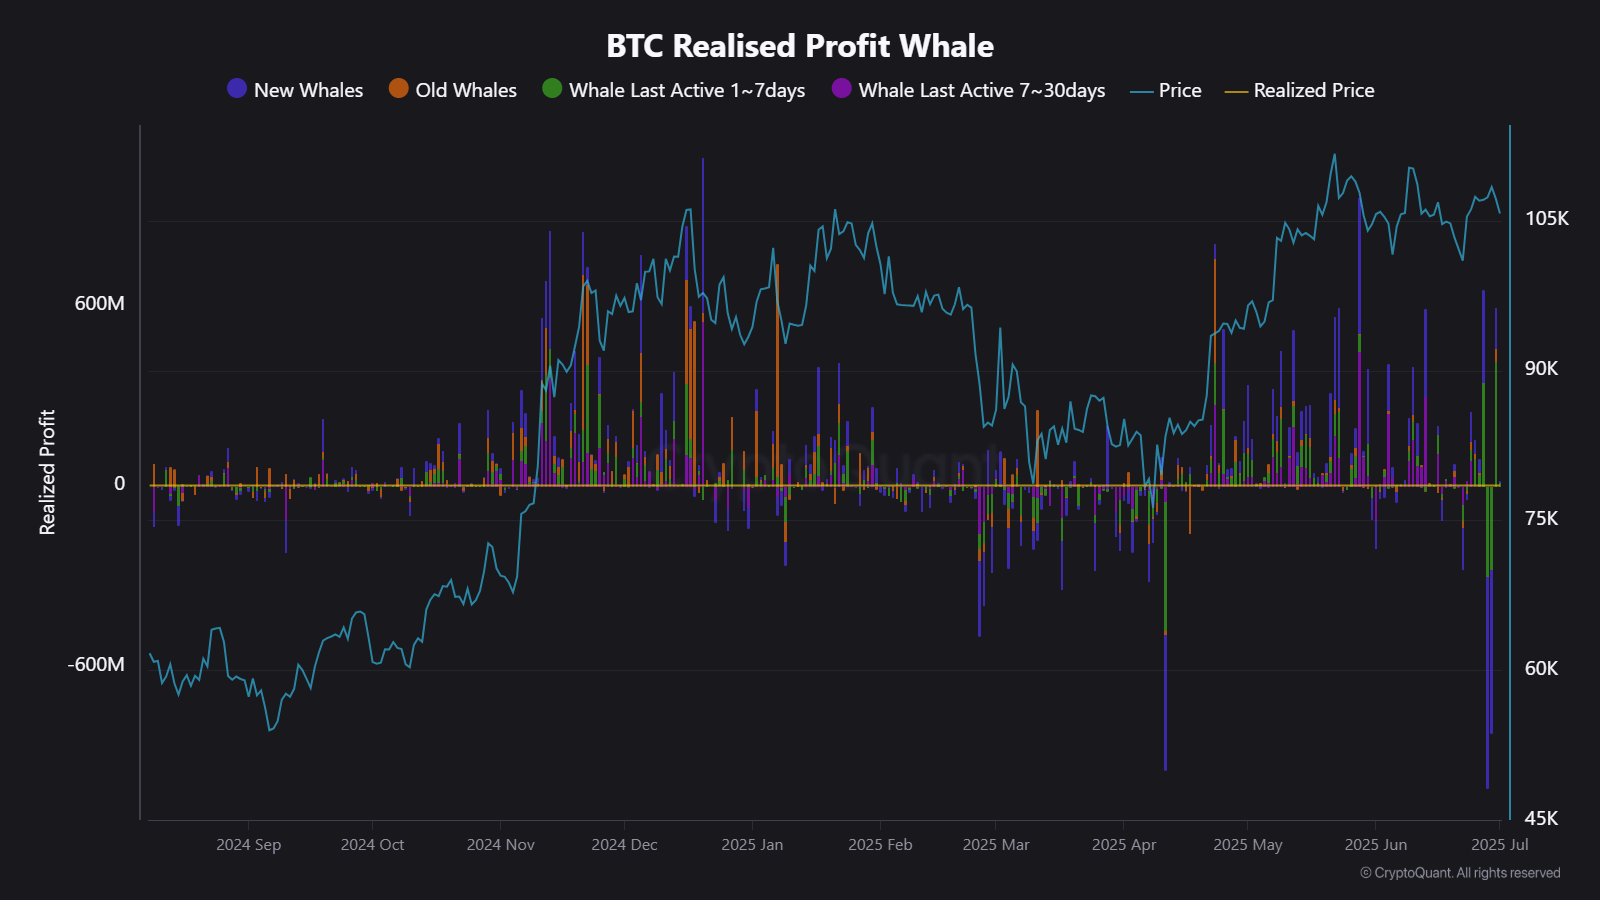
Whales Are Quietly Repositioning, Here’s What Bitcoin’s $107K Price Isn’t Telling You
Bitcoin continues to show little upward momentum as it trades below the $110,000 mark. As of the tim...
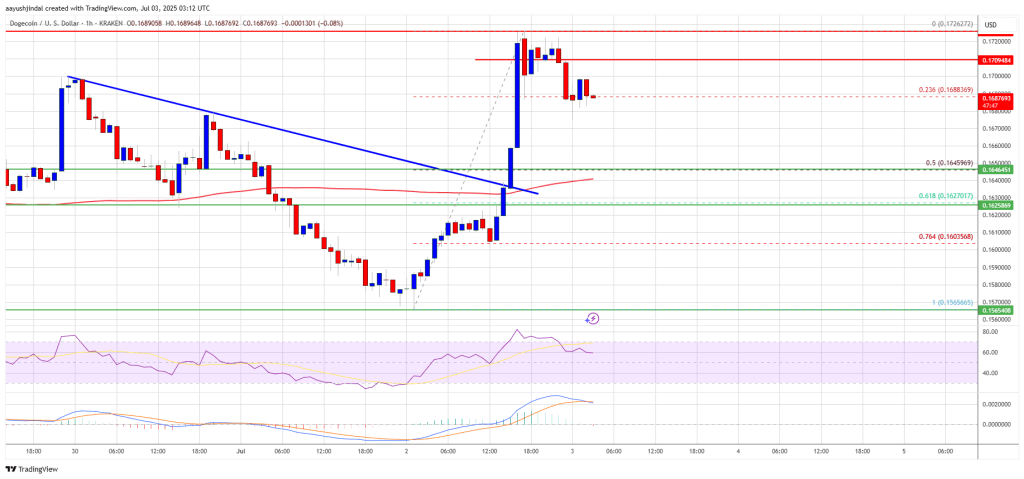
Dogecoin (DOGE) Bounces Off Lows, But $0.180 Cap Remains A Challenge
Dogecoin started a fresh increase above the $0.1650 zone against the US Dollar. DOGE is now consolid...