Cardano (ADA) Sideways — Support Intact, But No Spark for a Move Yet


Cardano price started a fresh decline from the $0.590 zone. ADA is now consolidating and might attempt a fresh increase above the $0.5820 zone.
- ADA price started a fresh decline below $0.5820 and $0.5750.
- The price is trading above $0.560 and the 100-hourly simple moving average.
- There is a key bullish trend line forming with support at $0.5640 on the hourly chart of the ADA/USD pair (data source from Kraken).
- The pair could start a fresh decline if it dips below the $0.5560 support zone.
Cardano Price Fails To Extend Gains
In the past few sessions, Cardano saw a fresh decline from the $0.590 zone, unlike Bitcoin and Ethereum . ADA declined below the $0.580 level and trimmed most gains.
The bears pushed the price below the 50% Fib retracement level of the upward move from the $0.5567 swing low to the $0.5902 high. The price even spiked below the $0.570 support but stayed above $0.5650. There is also a key bullish trend line forming with support at $0.5640 on the hourly chart of the ADA/USD pair.
The trend line is close to the 76.4% Fib retracement level of the upward move from the $0.5567 swing low to the $0.5902 high. Cardano price is now trading above $0.5650 and the 100-hourly simple moving average.
On the upside, the price might face resistance near the $0.5735 zone. The first resistance is near $0.5820. The next key resistance might be $0.590. If there is a close above the $0.590 resistance, the price could start a strong rally. In the stated case, the price could rise toward the $0.620 region. Any more gains might call for a move toward $0.6350 in the near term.
More Losses In ADA?
If Cardano’s price fails to climb above the $0.5820 resistance level, it could start another decline. Immediate support on the downside is near the $0.5640 level and the trend line.
The next major support is near the $0.5460 level. A downside break below the $0.5460 level could open the doors for a test of $0.5250. The next major support is near the $0.510 level where the bulls might emerge.
Technical Indicators
Hourly MACD – The MACD for ADA/USD is gaining momentum in the bearish zone.
Hourly RSI (Relative Strength Index) – The RSI for ADA/USD is now below the 50 level.
Major Support Levels – $0.5640 and $0.5460.
Major Resistance Levels – $0.5735 and $0.5820.

BitMine Stock Soars 700% After $250 Million Raise For Ethereum Treasury
Tom Lee, the market strategist known for his insightful predictions on Bitcoin (BTC) and broader cry...
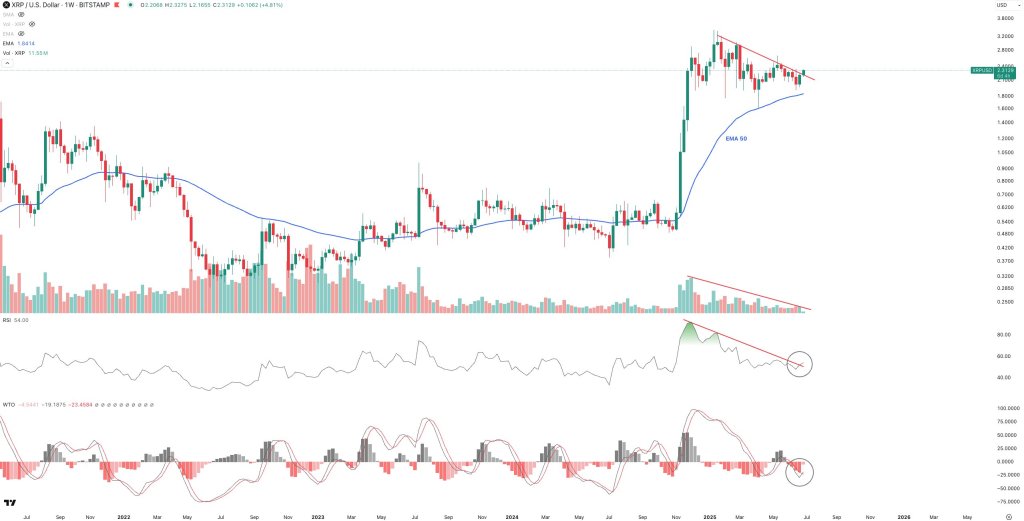
XRP Breaks Out Across The Board—But One Thing’s Missing
XRP has slipped the leash that has restrained it since the mid-January peak at $3.40, with the lates...
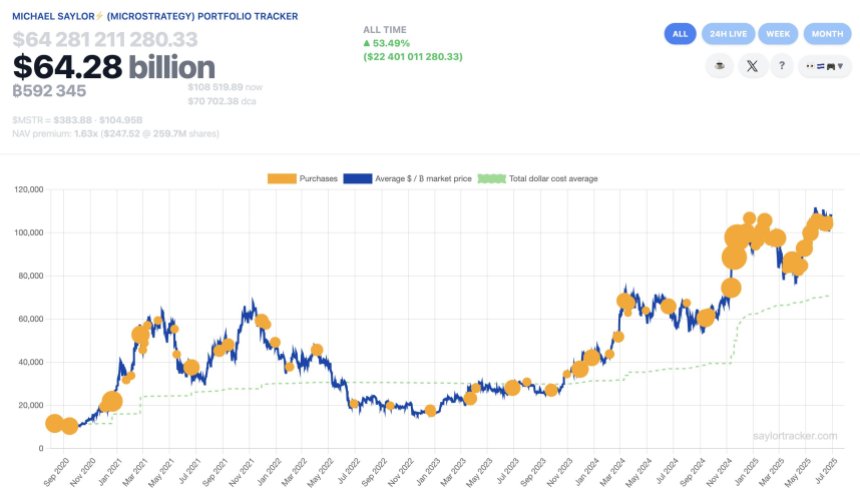
Bitcoin Shopping Spree: Strategy Continues Accumulation With $530M Purchase
Strategy (previously MicroStrategy), the leading corporate holder of Bitcoin (BTC), is on the verge ...