Bitcoin Forms 4-Year Inverse H&S Pattern – Neckline Break Could Send It Parabolic


Bitcoin is showing resilience above the $105,000 mark, holding firm despite ongoing volatility and economic uncertainty. While bulls struggle to break above the all-time high at $112,000, the market remains in a high-stakes consolidation phase. Macroeconomic conditions remain unstable, with weak global growth forecasts and elevated inflation pushing investors into risk-off assets. Still, Bitcoin appears to be thriving under these pressures, strengthening its case as a hedge against traditional financial instability.
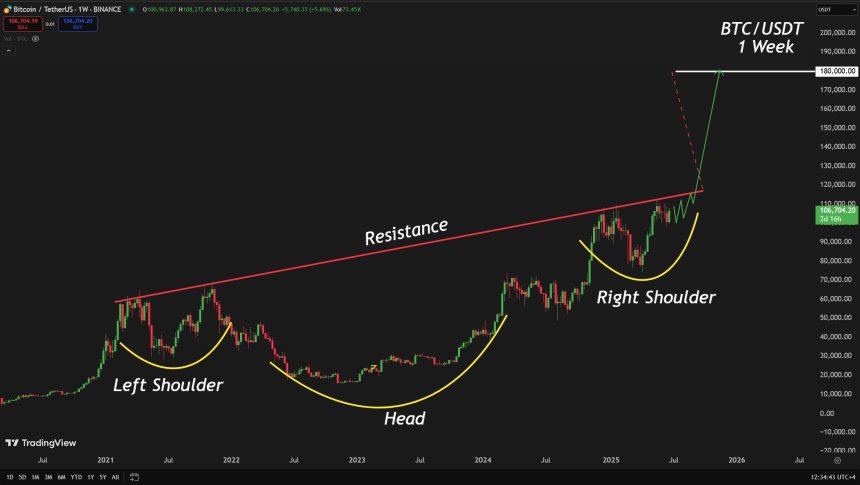
Top analyst Carl Runefelt recently highlighted a compelling technical development: Bitcoin is forming a massive inverse head and shoulders pattern spanning the last four years. This rare and long-term formation typically signals a bullish reversal and, if confirmed, could mark the beginning of a powerful breakout into price discovery. Runefelt notes that the neckline of this pattern aligns with current resistance just below $112K, making the coming weeks crucial for market direction.
As the crypto market digests geopolitical tensions, central bank policy shifts, and on-chain accumulation trends, Bitcoin’s ability to stay elevated signals growing investor conviction. All eyes are now on whether BTC can complete this historic pattern and launch the next leg of the bull run.
Bitcoin At A Critical Crossroads
Bitcoin is trading at a pivotal level that could determine the market’s next major move — a breakout into new all-time highs or a retrace toward lower demand zones. After surging over 10% since last Sunday, the bullish sentiment is building rapidly, but the price remains stuck in a tight range between $100,000 and $110,000. Bulls are confident and in control of momentum, yet they’ve repeatedly failed to push BTC above the key $110K resistance. At the same time, bears have been unable to take the price below the $100K psychological support, signaling equilibrium and mounting pressure for a breakout.
This standoff has kept volatility high, with macroeconomic uncertainty and geopolitical instability adding fuel to the fire. Still, the current market structure appears constructive for Bitcoin. If bulls can finally break above the $110K level and push into price discovery, it would confirm the strength behind this rally and potentially spark a new phase of exponential growth.
Carl Runefelt believes a major breakout may be on the horizon. His technical analysis reveals a massive inverse head and shoulders pattern forming over the last four years — a rare and highly bullish setup. According to Runefelt, traders should be “ready for a crazy pump” if Bitcoin breaks through the neckline near $112K. Historically, this type of pattern precedes explosive rallies, and given the long-term nature of this one, the upside potential could be significant.
As long-term holders accumulate and market liquidity builds, the coming weeks may determine whether Bitcoin cements its breakout or returns to test deeper support. Either way, this moment is shaping up to be one of the most decisive junctures in the current bull cycle.
BTC Price Analysis: Key Resistance Blocks Price Discovery
Bitcoin is currently trading at $107,144 on the daily chart, showing modest gains but facing strong resistance as it nears the $109,300 level. The chart highlights a clearly defined horizontal structure between $103,600 and $109,300 — a range Bitcoin has respected for nearly two months. Bulls remain in control short term, having reclaimed all three major moving averages: the 50-day ($105,800), 100-day ($96,784), and 200-day ($96,136) SMAs.
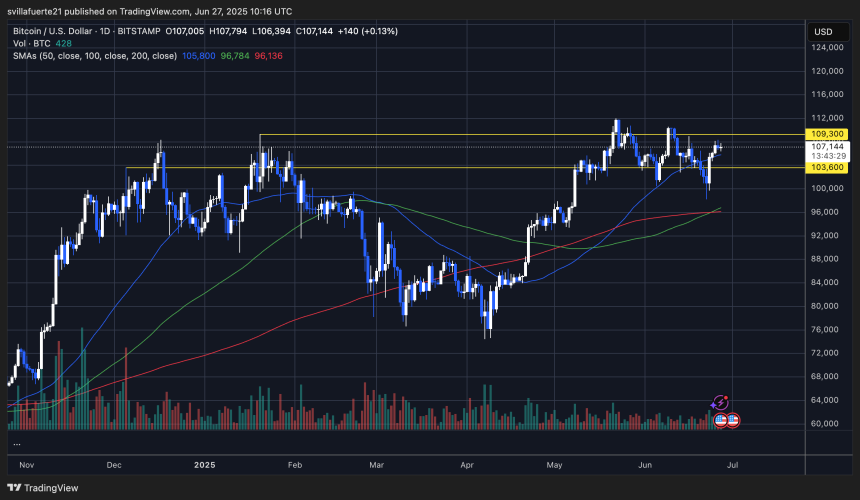
The most recent bounce off the $103,600 support zone was followed by rising volume, indicating a potential shift in momentum back to the upside. However, BTC has yet to close convincingly above $109,300, which continues to cap any price discovery attempts. A breakout above this level could open the door to new all-time highs and trigger an aggressive bullish continuation.
On the downside, failure to breach resistance and a drop below $105K could reintroduce bearish pressure and trigger a retest of the lower range. For now, Bitcoin remains range-bound with bullish bias, but buyers need to follow through with strong volume and a clean break above the $109K barrier to fully confirm market intent. Until then, caution is warranted as indecision prevails near key resistance.
Featured image from Dall-E, chart from TradingView

SEI Leads Crypto Market With 43% Weekly Surge – $0.5 Reclaim In The Horizon?
After breaking out of a bullish formation, SEI is attempting to reclaim a crucial level to continue ...
You Won’t Believe Who’s Moving Millions in Bitcoin on Binance Right Now
Bitcoin is treading cautiously below the $110,000 level, signaling a pause in momentum after recent ...
Ethereum Reclaims $2,500 In Squeeze-Driven Rally – But Can It Hold?
Ethereum (ETH) has recorded strong gains over the past two weeks, rising from $2,111 on June 12 to $...