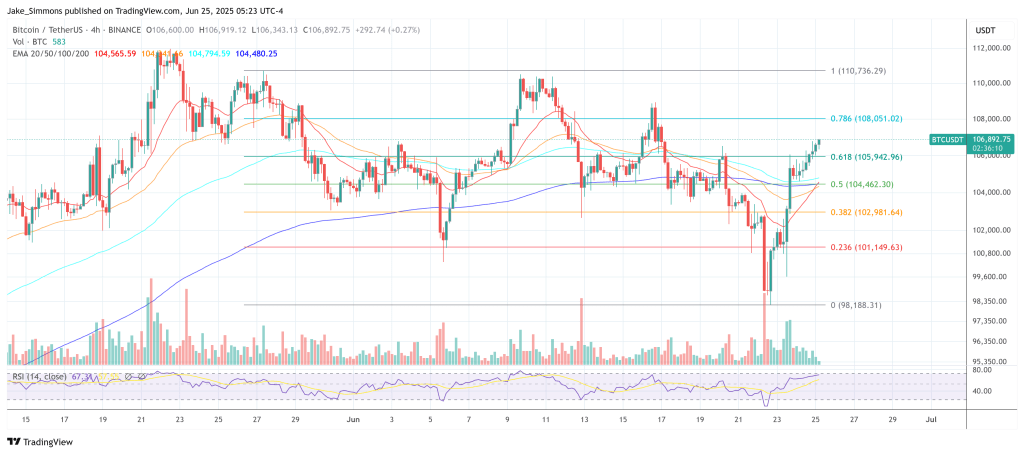
Bitcoin Price Pushes Up — ATH in Sight if Bulls Maintain Pressure


Bitcoin price started a fresh increase above the $103,250 zone. BTC is now consolidating and might aim for a move above the $106,500 resistance.
- Bitcoin started a fresh increase above the $105,000 zone.
- The price is trading above $103,500 and the 100 hourly Simple moving average.
- There is a bullish trend line forming with support at $106,000 on the hourly chart of the BTC/USD pair (data feed from Kraken).
- The pair could start a fresh increase if it stays above the $104,200 zone.
Bitcoin Price Eyes More Gains
Bitcoin price started a fresh increase above the $102,500 zone. BTC gained pace and was able to climb above the $103,200 and $103,500 levels to enter a positive zone.
The bulls pushed the price above the 76.4% Fib retracement level of the downward move from the $106,470 swing high to the $98,276 low. It opened the doors for a push above the $106,000 resistance and the price tested the $106,500 zone.
Bitcoin is now trading above $105,000 and the 100 hourly Simple moving average . There is also a bullish trend line forming with support at $106,000 on the hourly chart of the BTC/USD pair.
On the upside, immediate resistance is near the $106,500 level. The first key resistance is near the $107,200 level. The next key resistance could be $108,500 or the 1.236 Fib extension level of the downward move from the $106,470 swing high to the $98,276 low.
A close above the $108,500 resistance might send the price further higher. In the stated case, the price could rise and test the $110,000 resistance level. Any more gains might send the price toward the $112,000 level.
Another Drop In BTC?
If Bitcoin fails to rise above the $106,500 resistance zone, it could start another decline. Immediate support is near the $106,000 level. The first major support is near the $105,500 level.
The next support is now near the $104,200 zone. Any more losses might send the price toward the $103,500 support in the near term. The main support sits at $102,000, below which BTC might struggle to find bids.
Technical indicators:
Hourly MACD – The MACD is now gaining pace in the bullish zone.
Hourly RSI (Relative Strength Index) – The RSI for BTC/USD is now above the 50 level.
Major Support Levels – $106,000, followed by $105,500.
Major Resistance Levels – $106,500 and $108,500.
Crypto Rally Or Crash? Powell Just Made July The Market’s Make-Or-Break
Federal Reserve Chair Jerome Powell’s appearance on Capitol Hill Tuesday left risk-asset traders wit...

Trump’s Truth Social Officialy Files For Bitcoin And Ethereum ETFs With NYSE
Trump Media and Technology Group Corp (TMTG) has officially filed for its second crypto exchange-tra...
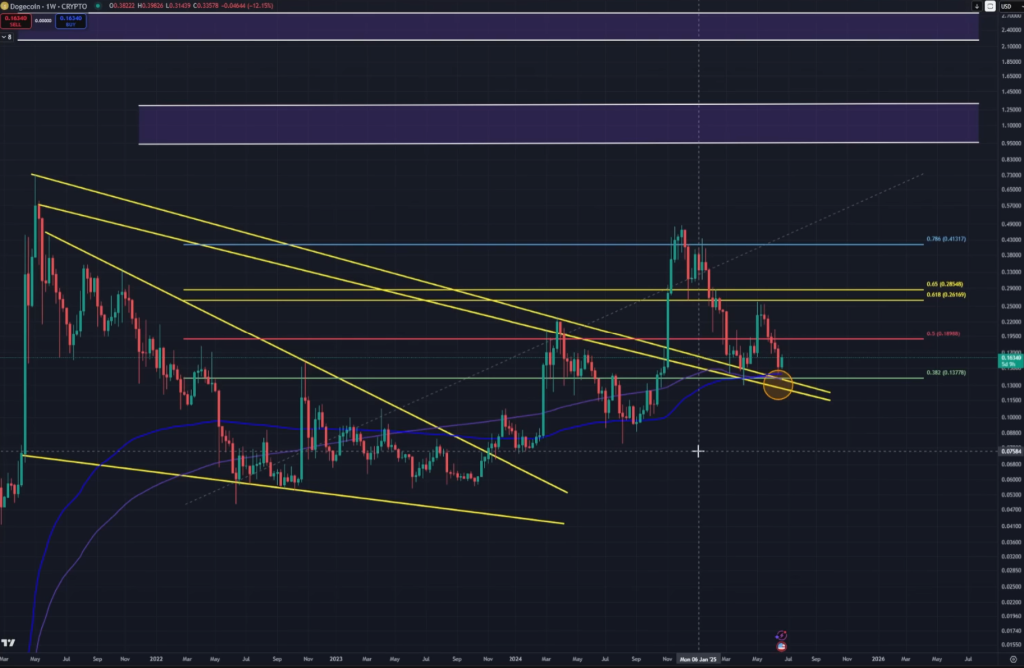
Dogecoin Flashes Rare Buy Signal—But One Move Could Ruin It
Dogecoin is once again at a technical crossroads, flashing a rare confluence of bullish indicators—b...