Bitcoin Price Turns Higher — Relief Rally Follows Reduction In Global Risk


Bitcoin price started a fresh increase from the $98,250 zone. BTC is now consolidating and might aim for a move above the $106,500 resistance.
- Bitcoin started a fresh increase above the $102,000 zone.
- The price is trading above $102,500 and the 100 hourly Simple moving average.
- There was a break above a key bearish trend line with resistance at $101,500 on the hourly chart of the BTC/USD pair (data feed from Kraken).
- The pair could start a fresh increase if it stays above the $102,500 zone.
Bitcoin Price Recovers Ground
Bitcoin price started a fresh increase from the $98,500 zone. BTC gained pace after Trump announced a ceasefire. The price was able to climb above the $102,000 and $103,200 levels.
Besides, there was a break above a key bearish trend line with resistance at $101,500 on the hourly chart of the BTC/USD pair. The pair cleared the 61.8% Fib retracement level of the downward move from the $106,470 swing high to the $98,277 low.
Finally, the price traded close to the $106,000 level. Bitcoin is now trading above $104,000 and the 100 hourly Simple moving average . It is also above the 76.4% Fib retracement level of the downward move from the $106,470 swing high to the $98,277 low.
On the upside, immediate resistance is near the $106,000 level. The first key resistance is near the $106,200 level. The next key resistance could be $106,500. A close above the $106,500 resistance might send the price further higher. In the stated case, the price could rise and test the $108,000 resistance level. Any more gains might send the price toward the $110,000 level.
Another Drop In BTC?
If Bitcoin fails to rise above the $106,000 resistance zone, it could start another decline. Immediate support is near the $104,000 level. The first major support is near the $103,500 level.
The next support is now near the $102,500 zone. Any more losses might send the price toward the $101,200 support in the near term. The main support sits at $100,000, below which BTC might struggle to find bids.
Technical indicators:
Hourly MACD – The MACD is now losing pace in the bullish zone.
Hourly RSI (Relative Strength Index) – The RSI for BTC/USD is now above the 50 level.
Major Support Levels – $104,000, followed by $103,500.
Major Resistance Levels – $106,000 and $106,500.
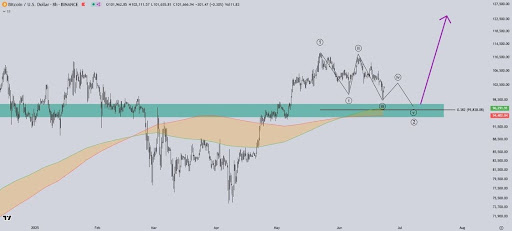
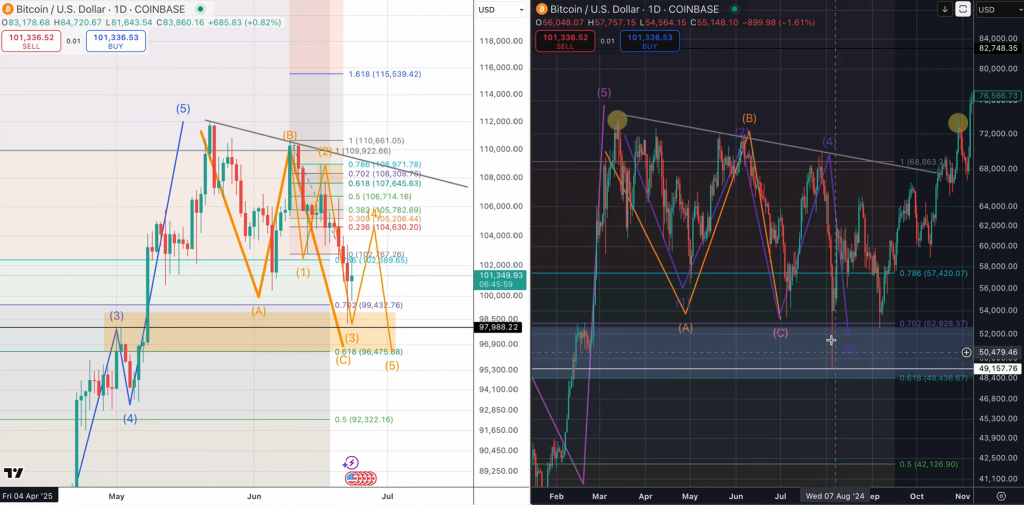
Bitcoin Elliott Wave Count Predicts Further Crash To $94,000, But What Next?
Bitcoin (BTC) has been facing significant volatility and downward pressure lately. However, analysts...
Bitcoin Repeats Its 2021 Pattern—Analyst Warns Final Crash Still Ahead
Bitcoin rallied above $105,000 in mid-morning European trading on Tuesday, clawing back losses susta...

Israel, Iran Ceasefire Ignites Crypto Surge As Bitcoin Tops $106,000—Details
An unexpected peace in the Middle East created waves in the crypto market on 24th June, 2025. Iran a...