XRP Price Tries to Bounce Back—But Hurdles May Delay the Comeback


XRP price started a fresh decline and tested the $2.080 zone. The price is now recovering and might aim for an upward move above the $2.20 resistance.
- XRP price started a decent upward move from the $2.080 zone.
- The price is now trading above $2.150 and the 100-hourly Simple Moving Average.
- There is a short-term rising channel forming with support at $2.140 on the hourly chart of the XRP/USD pair (data source from Kraken).
- The pair might start another increase if it clears the $2.20 resistance zone.
XRP Price Eyes Recovery
XRP price declined below the $2.250 and $2.20 levels, like Bitcoin and Ethereum . The price even declined below the $2.120 zone and tested the $2.080 support.
A low was formed at $2.085 and the price is now attempting to recover. There was a move above the $2.10 and $2.120 levels. The price climbed above the 23.6% Fib retracement level of the downward move from the $2.338 swing high to the $2.085 low.
Besides, there is a short-term rising channel forming with support at $2.140 on the hourly chart of the XRP/USD pair. The price is now trading above $2.150 and the 100-hourly Simple Moving Average.
On the upside, the price might face resistance near the $2.20 level. The first major resistance is near the $2.2120 level. It is close to the 50% Fib retracement level of the downward move from the $2.338 swing high to the $2.085 low.
The next resistance is $2.250. A clear move above the $2.250 resistance might send the price toward the $2.320 resistance. Any more gains might send the price toward the $2.350 resistance or even $2.3650 in the near term. The next major hurdle for the bulls might be $2.420.
Another Decline?
If XRP fails to clear the $2.20 resistance zone, it could start another decline. Initial support on the downside is near the $2.140 level and the trend line. The next major support is near the $2.120 level.
If there is a downside break and a close below the $2.120 level, the price might continue to decline toward the $2.080 support. The next major support sits near the $2.020 zone.
Technical Indicators
Hourly MACD – The MACD for XRP/USD is now gaining pace in the bullish zone.
Hourly RSI (Relative Strength Index) – The RSI for XRP/USD is now above the 50 level.
Major Support Levels – $2.150 and $2.120.
Major Resistance Levels – $2.20 and $2.2120.
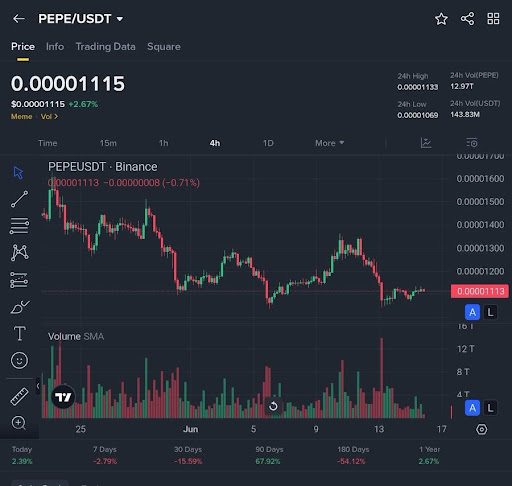
PEPE Pumps 2.67% – Is The Memecoin Preparing For A Major Rebound?
Taking a closer look at PEPE recent movement, Crypto Man MAB noted that the token is now trading at ...
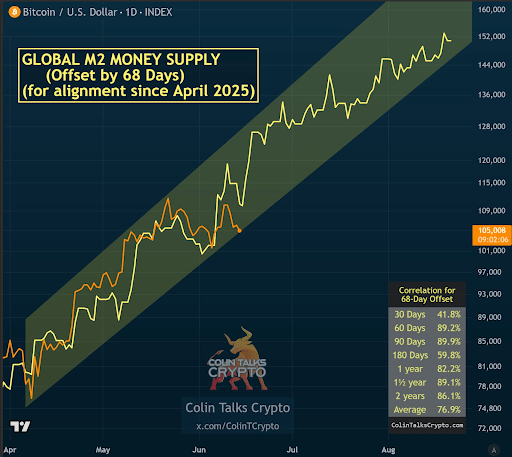
Will The Bitcoin Price Move Above $110,000 Again? Global M2 Money Supply Shows What’s Next
Bitcoin’s current trading range is all part of a consolidation move before a return above $110,000. ...

Vietnam’s Historic Move to Legalize Crypto Could Add Rocket Fuel to These Top Altcoins
Did the next major move in blockchain technology just come from Vietnam? Developing nations are beco...