Bitcoin Price Extends Losses — Is More Downside on the Horizon?


Bitcoin price started a fresh decline and tested the $104,600 zone. BTC is now consolidating and might struggle to recover above $107,500.
- Bitcoin started a fresh decline below the $107,500 zone.
- The price is trading below $107,000 and the 100 hourly Simple moving average.
- There is a connecting bearish trend line forming with resistance at $107,550 on the hourly chart of the BTC/USD pair (data feed from Kraken).
- The pair could extend losses if it breaks the $104,000 support zone.
Bitcoin Price Dips Further
Bitcoin price started a fresh decline and traded below the $107,500 support zone . BTC even traded below the $105,600 level and tested the next support at $104,600.
A low was formed at $104,604 and the price is now consolidating losses. There was a move above the $105,200 level, but the price is still below the 23.6% Fib retracement level of the recent decline from the $110,500 swing high to the $104,604 low.
Bitcoin is now trading below $107,000 and the 100 hourly Simple moving average . On the upside, immediate resistance is near the $106,000 level.
The first key resistance is near the $107,000 level. The next key resistance could be $107,500. There is also a connecting bearish trend line forming with resistance at $107,550 on the hourly chart of the BTC/USD pair. It is close to the 50% Fib retracement level of the recent decline from the $110,500 swing high to the $104,604 low.
A close above the $107,500 resistance might send the price further higher. In the stated case, the price could rise and test the $108,000 resistance level. Any more gains might send the price toward the $110,000 level.
Another Drop In BTC?
If Bitcoin fails to rise above the $107,500 resistance zone, it could start another decline. Immediate support is near the $104,500 level. The first major support is near the $104,000 level.
The next support is now near the $103,200 zone. Any more losses might send the price toward the $102,500 support in the near term. The main support sits at $101,200, below which BTC might gain bearish momentum.
Technical indicators:
Hourly MACD – The MACD is now gaining pace in the bearish zone.
Hourly RSI (Relative Strength Index) – The RSI for BTC/USD is now below the 50 level.
Major Support Levels – $104,000, followed by $103,200.
Major Resistance Levels – $106,000 and $107,000.

Bitcoin Maxi Max Keiser Isn’t Buying The Hype Around New Crypto Holding Companies
Bitcoin advocate Max Keiser has questioned whether new Bitcoin treasury companies will show the same...
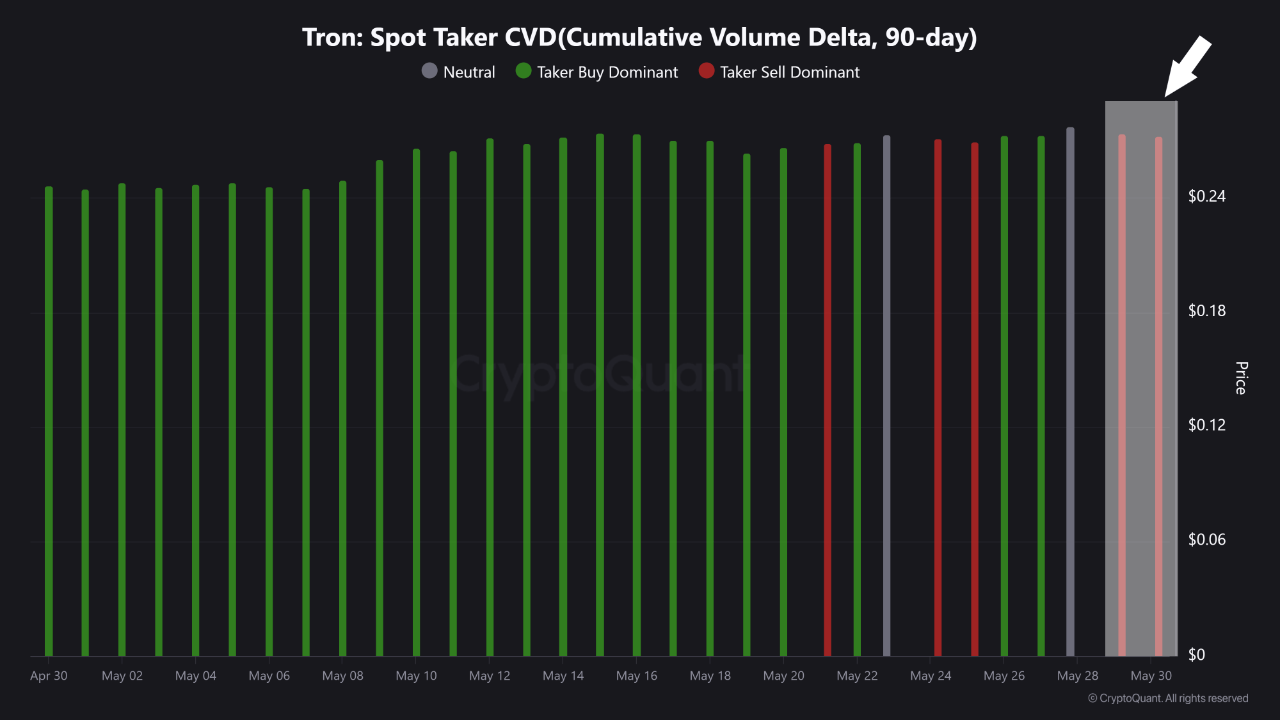
Analyst Explains Reason Behind Tron Price Sluggishness — Are TRX Bears Now In Control?
The Tron price has continued on its recovery path since reaching a bottom in mid-March, steadily cli...
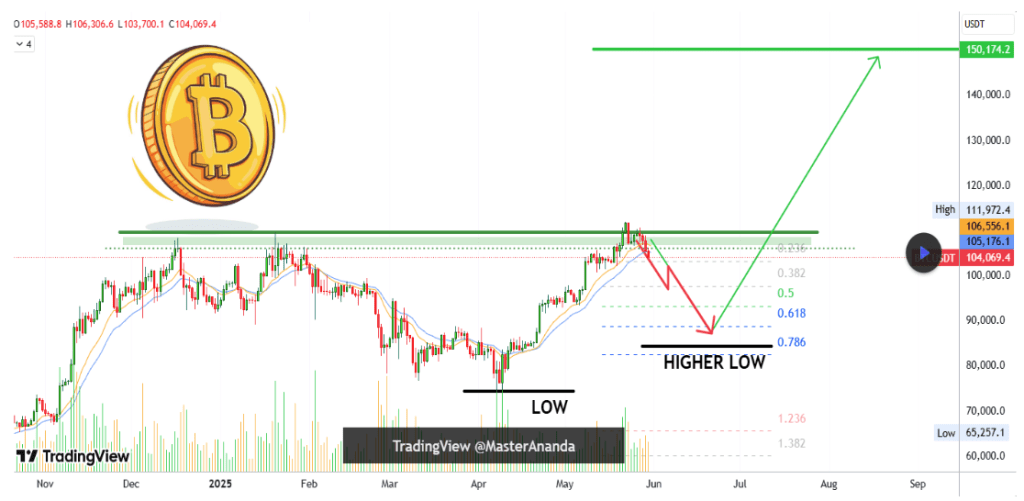
Bitcoin Still Bullish, But $200,000 Off The Table And $137,000 In Sight
Bitcoin’s price action has drawn a sharp dividing line between long-term bullish expectations and sh...