




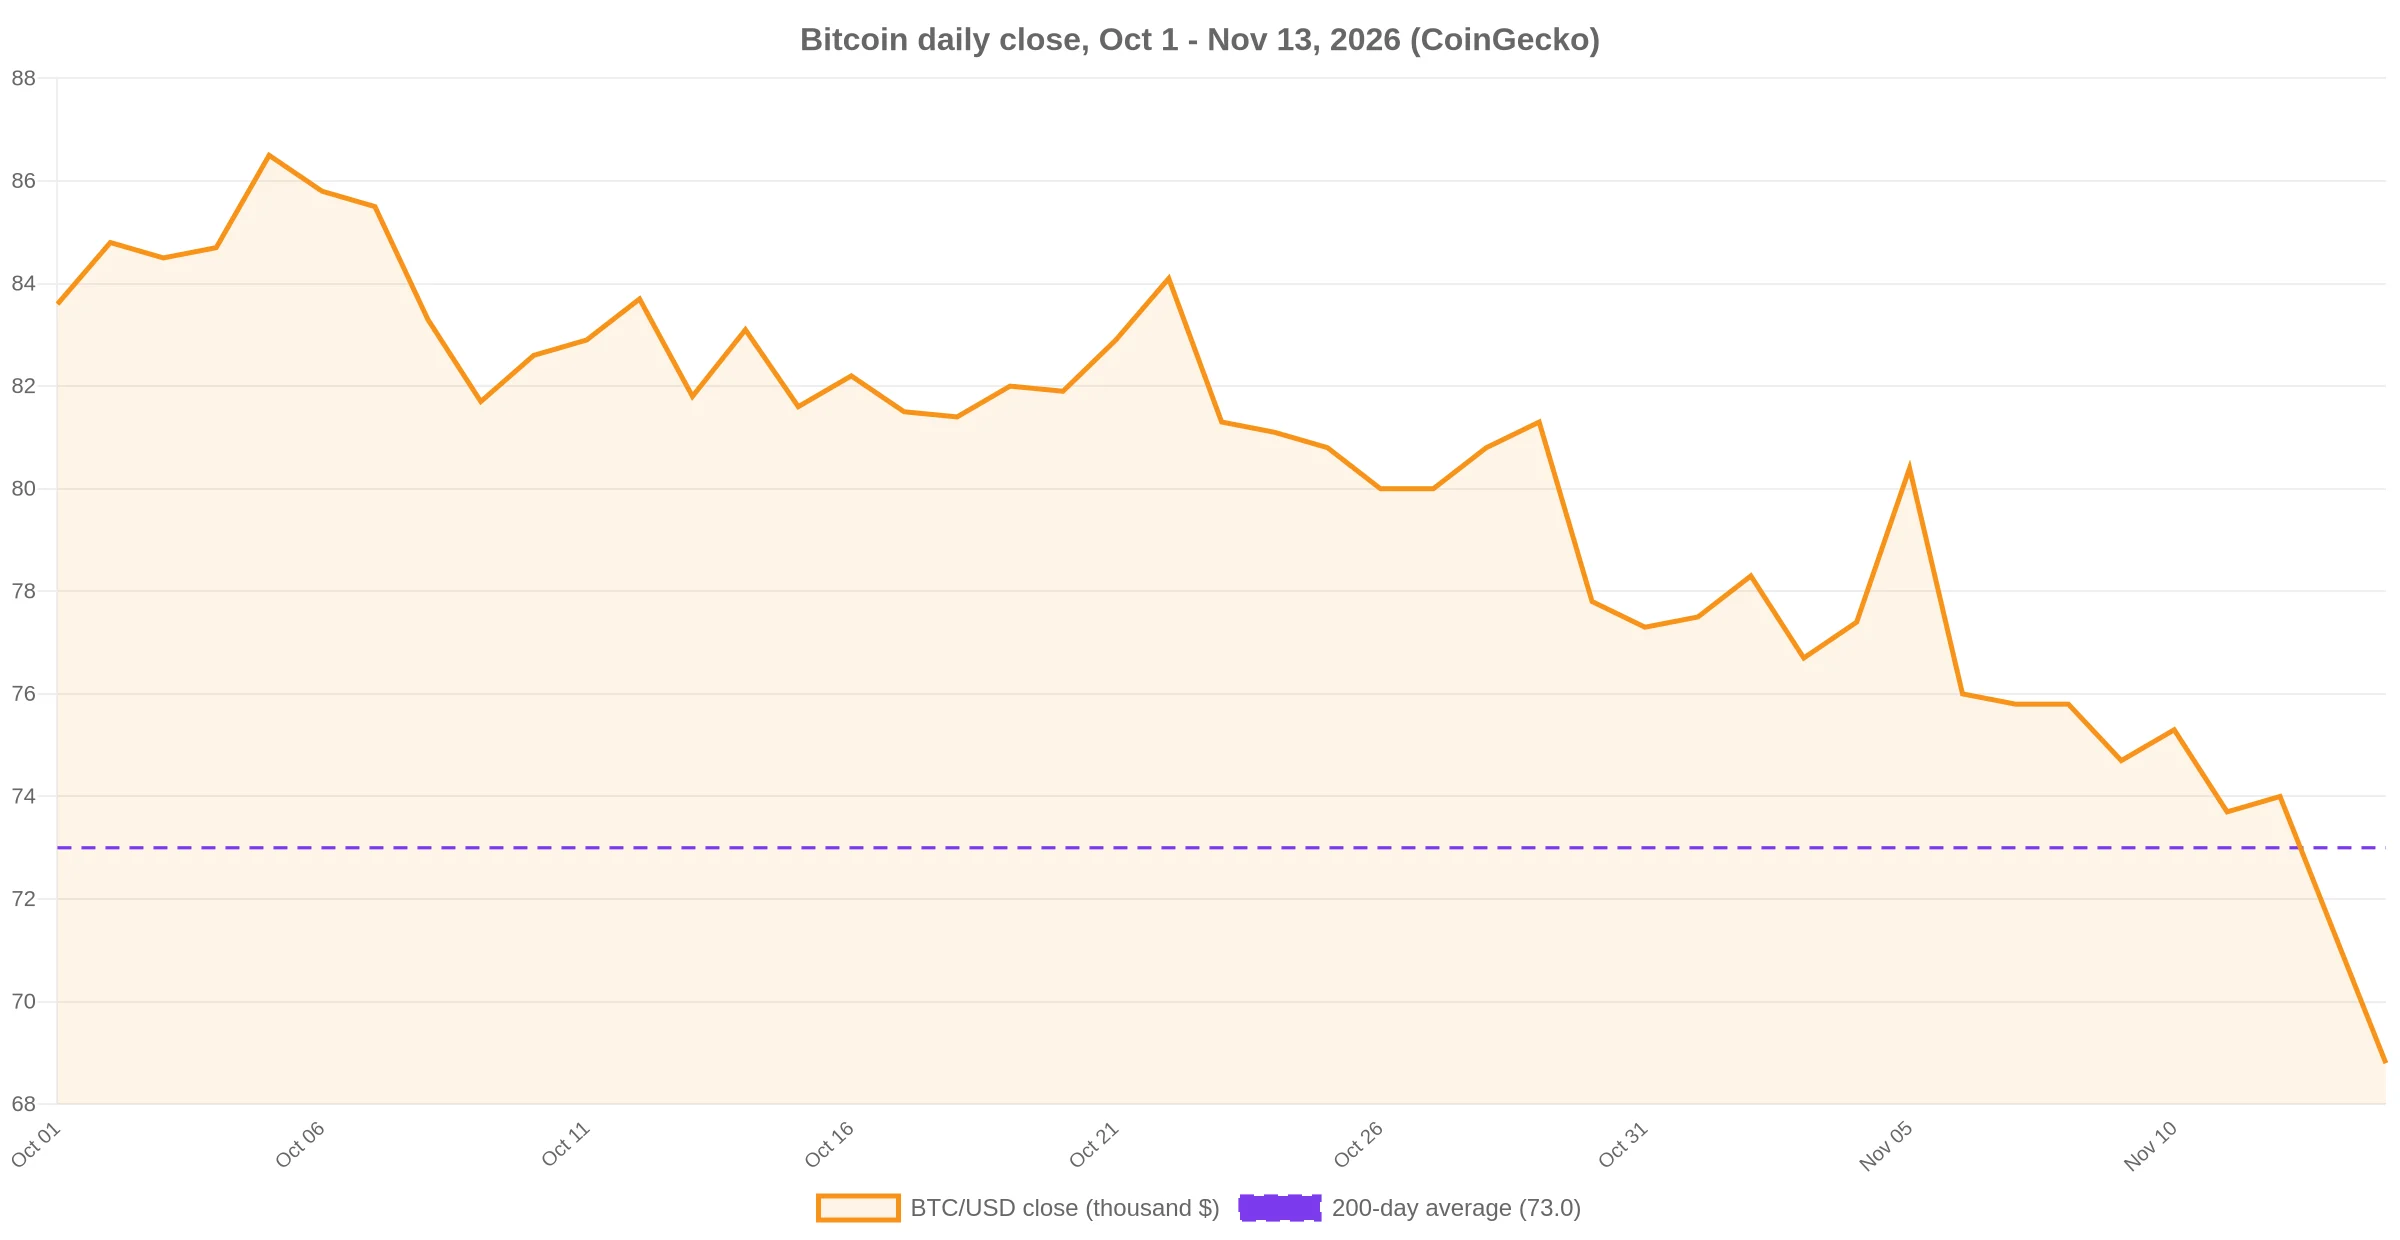
Bitcoin traded at $68,688 at 09:05 UTC on November 13, down 6.56% in 24 hours and 27.5% below its January 18 high of $94,803. Ether changed hands at $1,931.30, below $1,940 for the first time since mid-August on CoinGecko’s daily series. The whole market was worth $2.35 trillion, down 7.05% on the day.
The number that matters more than the quote is underneath it. CoinGlass recorded 183,354 traders liquidated for $1.62 billion in 24 hours, and $1.46 billion of that, or 89.9%, was long. Bitcoin alone accounted for $870.16 million of forced selling and Ether $258.00 million. This was not a market that sold off in an orderly way; it was a market where one side of the book was too crowded and got removed.
By 11:20 UTC the quote had recovered to $69,246 on CoinGecko, 5.5% below the 200-day average, with total market value at $2.33 trillion. The bounce does not repair the structure the flush exposed: leverage on the long side was heavy, and spot ETF flows were already negative before the cascade began.
| Asset | Price, 09:05 UTC | 24h | Market cap | 24h volume |
|---|---|---|---|---|
| BTC | $68,688 | -6.56% | $1.382 trillion | $44.18 billion |
| ETH | $1,931.30 | -5.69% | $236.04 billion | $15.51 billion |
| SOL | $79.75 | -3.78% | $47.19 billion | $3.35 billion |
| XRP | $1.027 | -1.64% | $65.25 billion | $2.08 billion |
The flush was one-sided, and that is the story
Short liquidations were $164.60 million against $1.46 billion of longs. When the damage is that lopsided, the move is telling you where leverage sat before the drop, not what news arrived during it.
The venue split is just as instructive. Over the four hours of heaviest trading, CoinGlass counted $955.47 million of liquidations: Binance $358.87 million, Hyperliquid $235.38 million, Bybit $125.00 million, Gate $115.25 million and Bitget $32.10 million. Over 24 hours, Binance carried 35.4% of the total. The single largest order was a $31.09 million BTC-USD long on Hyperliquid that was liquidated at $72,250, roughly 4.6% above the current price. Positions opened in the low $70,000s did not survive the move, which is what makes the 200-day average at $73,046 a painful reference point rather than a comfortable one.
Scale helps here. The $1.62 billion print is 8.5% of the $19.16 billion recorded on October 10, 2025, the largest single liquidation day in CoinGlass’s table, and smaller than the $2.99 billion of August 18, 2026. On the exchange’s own numbers, this was a serious flush, not a record one.
What survived the flush is a hint about where the leverage was. XRP fell 1.64% while bitcoin fell 6.56%, and Solana lost 3.78%. If the selling had been broad de-risking, the smaller and less liquid assets would have taken the larger percentage hits. They did not, which points at bitcoin and ether perps as the crowded trades rather than a general exit from the asset class.
It is also small next to the value that disappeared. Total market capitalization fell from about $2.53 trillion to $2.35 trillion in 24 hours, a loss near $178 billion. The $1.62 billion of liquidations is 0.91% of that. Forced selling marked the edge of the repricing. The rest happened in spot and in the flows behind it, which is the part most liquidation commentary skips.
What changed on the rates side this week
The Treasury sold $125 billion of notes and bonds in five days, refunding about $97 billion of maturing paper and raising roughly $28 billion of new cash. The schedule ran $58 billion of three-year notes on November 9, $42 billion of ten-year notes on November 10 and $25 billion of 30-year bonds on November 12, all settling November 16, according to the quarterly refunding statement published on November 4.
The long end took the supply. Treasury’s daily par yield curve puts the 30-year at 5.43% on November 12, up from 5.25% on November 5. The 10-year moved to 5.10% from 4.84% over the same five sessions, a 26-basis-point rise, and the two-year went from 4.46% to 4.86%. The 30-year now sits 33 basis points above the 10-year, a steeper curve than a week ago.
One caveat keeps this honest. The 10-year is still below the 5.31% it printed on October 5, when bitcoin traded near $83,000. The level is not new. The direction is, and so is the calendar behind it.
That calendar includes the Treasury’s cash balance. The same statement projects the Treasury General Account could peak at $1.025 trillion, give or take $50 billion, in late November and again in late January, against an $850 billion year-end assumption. That is roughly $175 billion of cash pulled into a government account before it comes back out. “Treasury continues to see strong demand for bill securities from a broad range of market participants,” the statement reads, which is why the build can happen through bills without a visible yield concession.
Coupon sizes are not coming down to help. “Treasury believes its current auction sizes leave it well positioned to address potential changes to the fiscal outlook and to the size and composition of the SOMA portfolio,” the statement says, and any adjustment would be “guided by the objective of financing the government at the lowest cost over time.” The same document schedules buybacks of up to $70 billion of off-the-run securities for liquidity support and up to $25 billion in the one-month to two-year bucket for cash management, operations that remove paper from the market but are themselves funded by bill issuance. None of that is a smaller supply calendar for the long end next quarter.
ETF demand stopped absorbing the supply
US spot bitcoin funds flipped to a $27.5 million net inflow on November 11, according to bitbo’s flow table . One day is not a trend, and this one came from a single issuer: MSBT added $27.9 million while ARKB lost $0.4 million and the rest printed flat.
Before that, four consecutive sessions of redemptions: $419.7 million on November 5, $349.3 million on November 6, $191.1 million on November 9 and $369.0 million on November 10. That is $1.33 billion out in four sessions, with BlackRock’s IBIT responsible for $332.8 million on November 10 alone.
| Fund | Net flow, 10 sessions (US$m) |
|---|---|
| IBIT | -1,870.3 |
| FBTC | -140.1 |
| GBTC | -111.2 |
| BTC | -61.8 |
| ARKB | -28.6 |
| HODL | -22.2 |
| BITB | -2.5 |
| BTCW | -0.1 |
| BITA | -0.0 |
| EZBC | -0.0 |
| DEFI | 0.0 |
| BRRR | 0.0 |
| BTCO | +3.5 |
| MSBT | +51.9 |
| Total | -2,181.5 |
Put the two numbers side by side. Ten sessions of ETF redemptions removed $2.18 billion, equal to 0.16% of bitcoin’s $1.38 trillion market value, and IBIT supplied 85.7% of the redemptions on its own. Bitcoin lost $97 billion of market value in the 24 hours to 09:05 UTC. Flow data explains the drift, not the size of the drop. Leverage explains the size.
The levels that matter now
Bitcoin’s 200-day average sits at $73,046 on CoinGecko’s daily series, 5.97% above the 09:05 quote, so the trend line that held through the autumn is now overhead. Reclaiming it requires a 6.3% move from that snapshot, or 5.5% from the 11:20 price of $69,246, and a daily close above it would be the first evidence that the November decline is a range rather than a leg lower.
The short-term bands agree. The 20-day Bollinger midline is $76,651 with a lower band at $70,404; price is already outside the band, which marks stretched conditions rather than a floor. Fourteen-day RSI, calculated from the same daily closes, is 25.4.
The 30-day range runs from $68,760 to $84,082. Today’s low is the bottom of that range, so there is no higher low to lean on. The reference point below is the August 2026 low close of $63,031, set on August 16. A daily close under today’s low near $67,900 keeps that August level in play. A close back above $73,046 invalidates the immediate bearish read.
The ratio traders watch for rotation is doing what a defensive tape usually does. Ether at $1,931.30 against bitcoin at $68,688 puts ETH/BTC at 0.0281, below the 0.0295 that our November 8 reading of the ratio recorded. Ether is 19.4% lower over 30 days against bitcoin’s 15.7%.
What would change the picture
Three dated events sit inside the next three weeks. The Treasury General Account builds through late November, which drains reserves precisely when the funds have been selling. The FOMC meets December 8 and 9 with a Summary of Economic Projections, the last scheduled projection round of the year. And MSCI’s removal of Strategy from its indexes takes effect November 30, a mechanical change that forces index-tracking funds to sell regardless of price, which we covered when the final constituent list was confirmed .
For the tape itself, two things are measurable rather than narrative. The first is whether the 30-year holds below its November 12 close of 5.43% once the auction settles on November 16 and the supply calendar empties for a week. The second is whether ETF flows print a second consecutive inflow day, which would turn a single session into a change of direction rather than a pause in redemptions.
Neither is visible yet. What is visible is a market in which the long side paid for the positioning, the Treasury is still issuing into a 5%+ long end, and the largest pool of price-insensitive demand, the spot ETFs, has been a net seller for two weeks.
Data: CoinGecko , CoinGlass , bitbo , U.S. Treasury .
This article is not investment advice. Price and flow figures are as of the timestamps stated and change continuously.