
US spot Bitcoin and Ethereum ETFs recorded a net inflow of $2.6 billion in the week ending August 21, the largest weekly total since October 2025, according to Sosovalue data.
That reversed the prior week's $392 million outflow. Bitcoin funds alone brought in $1.9 billion over the five trading days, while ether funds added $697.2 million.
The inflows built steadily through the week: $297.6 million on Monday, August 17; $189.3 million on Tuesday; $517.2 million on Wednesday, the largest single day since May; and $606.3 million on Thursday, August 20, the biggest day of the run. BlackRock's IBIT alone accounted for roughly 83% of Thursday's total.
Bitcoin ETF trading volume for the week reached $22.1 billion, more than triple the prior week's $6.9 billion. Assets under management rose 25.4% to $96.1 billion, or roughly 6% of Bitcoin's total market value. Cumulative net inflows into US spot Bitcoin ETFs have reached $53.7 billion since they began trading in January 2024.
The Treasury Liquidity Trigger
The catalyst had nothing to do with crypto directly. On August 19, Treasury Secretary Scott Bessent said the department would raise the size of its long-term bond buyback operations to at least $4 billion per operation, part of an effort to bring down long-term borrowing costs, according to CNBC .
The announcement produced an immediate spillover into risk assets. BTC Markets analyst Rachael Lucas, who covers ETF flows and liquidity conditions closely, described the shift as a swing from investor apathy toward renewed buying enthusiasm once the buyback news landed, consistent with her regular market commentary for BTC Markets .
The 10-year and 30-year Treasury yields were little changed on the week, holding near 4.74% and 5.28% respectively, even as Bitcoin posted a 22.7% weekly gain. That gap between a sizable crypto rally and largely unmoved yields means much of the move's durability rests on the buyback program continuing at its current pace, rather than on rates actually falling further. Brent crude, meanwhile, was trading near $94 a barrel by the end of the week, according to Vantage Markets .
The US also made headway on crypto-specific policy. At a White House event on August 19, President Trump urged Congress to pass the CLARITY Act, which has stalled in the Senate, and met with crypto industry executives while pushing for what he called a "fair version" of the bill, according to CCN . He also said further purchases of Bitcoin by the US government "have been discussed."
Greed and Its Discontents
The Crypto Fear & Greed Index hit 71 on August 22, approaching the level seen just before the October 2025 flash crash. Bitcoin's daily relative strength index climbed to roughly 84, the most overbought reading since 2023.
Net ETF inflows totaled $2.6 billion for the week, but assets under management across both Bitcoin and Ethereum ETFs rose by roughly $23 billion. That gap points to price appreciation on existing holdings, not fresh capital, as the larger driver of the AUM jump: the valuation effect was close to nine times the size of the new money coming in.
The technical path higher does not get easier from here. Bitcoin has broken above its 200-day moving average and the 23.6% Fibonacci retracement level, putting the 38.2% level, near $84,000, as its next test. On-chain analyst Ali Martinez has pointed to limited overhead resistance above roughly $75,700, with the next real concentration of prior trading not appearing until the $83,300 to $84,600 zone, meaning a break higher could move quickly through that stretch rather than stall on heavy selling.
Weekend Reckoning
Geopolitical developments collided with the institutional buying narrative over the weekend. Cryptocurrencies fell on August 22 and 23 as US-Iran tensions escalated, with Bitcoin, Ethereum and Dogecoin sliding while XRP held roughly flat. Bitcoin, which had touched a high of $79,000 earlier in the week, briefly fell to $75,800.
Some of the pullback reflected ordinary profit-taking after a 22.7% weekly gain, as traders lightened positions built during the rally. The renewed friction between Washington and Tehran added a second, harder-to-price source of pressure on top of that.
Altcoin Stagnation Divergence, Technical Resistance and Structural Questions
The ETF inflows have not produced a broader rotation into altcoins. Total altcoin market capitalization has held around $886 billion, with Bitcoin retaining close to 58% of the overall crypto market, per CoinGecko data. Institutional capital moving through ETFs continues to concentrate in Bitcoin's deeper liquidity and clearer regulatory footing, particularly against a geopolitical backdrop that makes investors more selective, even as the SEC works through a broader framework for token issuance.
Bitcoin's 21-week exponential moving average is converging with a longer-term macro downtrend line, a setup that crypto analyst Rekt Capital has been tracking in recent technical updates. A weekly close above that downtrend line would be needed to confirm a fresh bullish phase; failing that, Bitcoin risks a slide back toward its 50-month EMA.
The Coinbase Bitcoin Premium Index, a gauge of US buying pressure relative to other markets, spent much of 2026 in negative territory, at one point marking a record streak of more than 90 consecutive negative days. It flickered briefly positive during this week's rally before slipping back into negative territory days later. The brief flip points to a modest, not yet confirmed, improvement in US spot demand.
A large share of the roughly 44,300 BTC that moved onto exchanges over the following days came from short-term holders locking in gains, the largest such profit-taking transfer since earlier this year, according to Bloomingbit . Whether ETF demand can absorb that supply matters more than the headline flow number itself.
The cumulative shortfall for Bitcoin and Ethereum ETFs this year has narrowed to roughly $3.1 billion combined, from a deeper deficit earlier in 2026, according to The Block . The products remain in negative territory for the year despite the recent surge.
The Real Test
Institutional demand was unmistakable in the week ending August 21, but the weekend pullback was a reminder of how quickly sentiment can turn. The Treasury's buyback program has provided a short-term liquidity boost, but at $4 billion per operation, it is a modest offset against a Bitcoin market now worth roughly $1.5 trillion.
The CryptoQuant Bull Score, a composite of on-chain demand indicators, crossed 60 for the first time since October 2025, a threshold analysts treat as separating bullish from bearish conditions, according to FXStreet . Whether it holds above that level in the coming weeks will say more about the durability of the rally than this week's flow numbers alone.
Short-term support sits between $75,000 and $76,000, with resistance concentrated between $79,000 and $80,000. A hold above $77,000 with sustained volume would keep the uptrend intact; failing that, continued volatility and profit-taking look like the more likely path after such a rapid run-up.
Additional sanctions measures against Iran, expected to be detailed on August 24, add another source of uncertainty heading into next week, even as markets have largely priced in the Treasury's buyback plans.
Bridgewater founder Ray Dalio has said US fiscal policy is nearing a crossroads and has urged investors to hold 10% to 15% of their portfolios in gold, alongside a smaller allocation to Bitcoin, as a hedge against monetary and fiscal instability, according to Bloomberg . How institutional confidence holds up against that backdrop will be tested again this week.
What Other Technical Readings Show
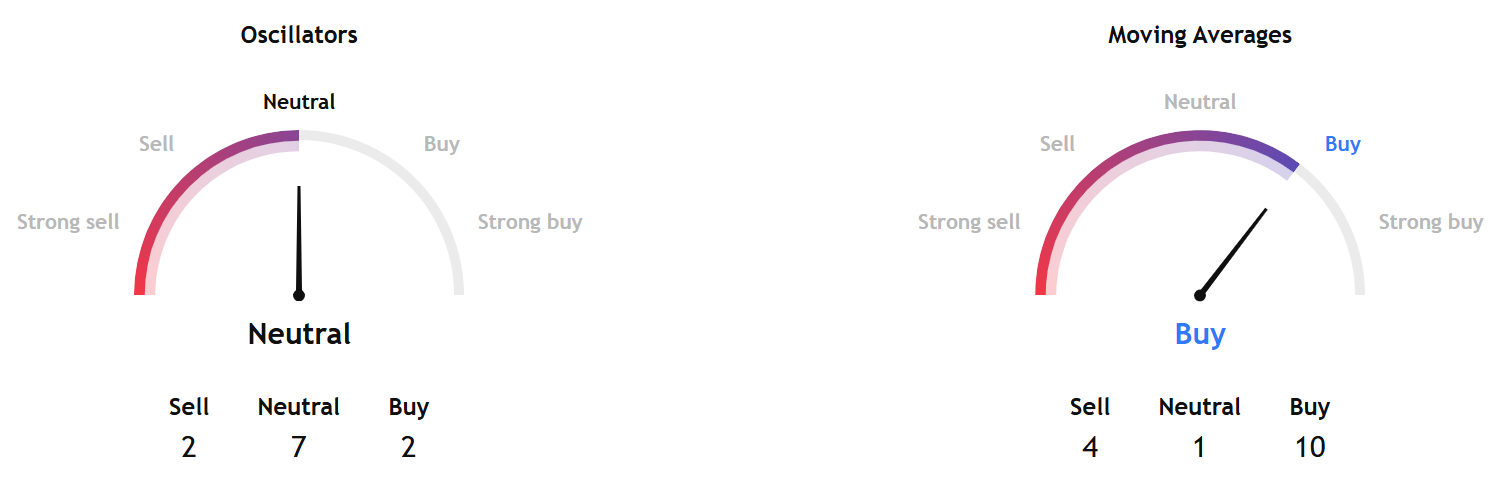
TradingView's technical analysis overview, based on moving averages, oscillators and pivots for the coming week, showed a buy signal.
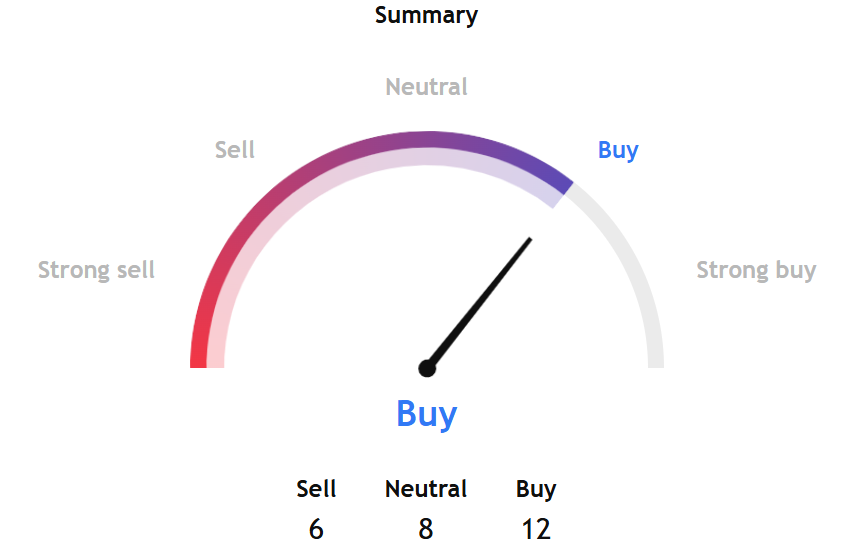
The short- and long-term sub-indicators also pointed to a positive outlook.
Separately, Investtech's Algorithmic Overall Analysis gave a positive score, with a recommendation for one-to-six weeks also positive.
The research said, "Bitcoin has broken up from an approximate horizontal trend channel in the short term after investors have paid ever more. A positive signal has been triggered, and further increase for the currency is indicated. There is no resistance in the price chart, and a further rise is indicated. In case of a negative reaction, the currency has support at approximately $64,800."
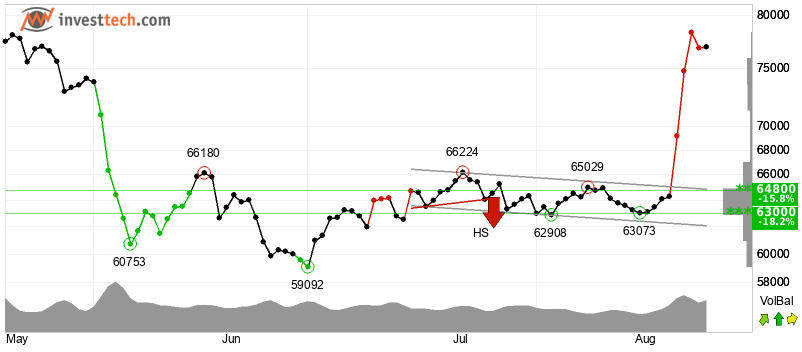
InvestTech added, "Positive volume balance strengthens the currency in the short term. RSI is above 70 after a good price increase in the past weeks. The currency has strong positive momentum, and further increase is indicated. However, particularly for big stocks, high RSI may be a sign that the stock is overbought and that there is a chance of a downward reaction. The token is overall assessed as technically positive for the short term."