



Market cap is what the tokens currently in circulation are worth at today’s price. Fully diluted valuation (FDV) is what every token in existence would be worth if the entire supply traded at that same price right now. The two formulas are simple:
- Market Cap = Price × Circulating Supply
- FDV = Price × Total (or Maximum) Supply
The gap between them is a dilution map. A large FDV relative to market cap means a significant portion of the total supply is still locked, vested, or unminted — and when those tokens unlock, they can push prices down. According to DEXTools, FDV will always be equal to or greater than market cap, and the size of that gap is a practical indicator of future dilution risk.
Pro Tip: *Before buying any token, pull the unlock schedule from the project’s documentation or CoinGecko.
Key Takeaways
The FDV vs market cap gap is a dilution map: the wider the gap, the more supply pressure a token faces as locked tokens unlock over time.
| Point | Details |
|---|---|
| Two formulas, two time horizons | Market Cap = Price × Circulating Supply; FDV = Price × Total/Max Supply. |
| Ratio threshold to watch | A Market Cap / FDV ratio below 0.2 means over 80% of supply is still locked — investigate before buying. |
| Unlock timing is everything | A near-term cliff unlock is far riskier than a distant linear schedule, even at identical FDV gaps. |
| Neither metric works alone | FDV ignores timing and demand changes; market cap hides locked supply. Use both together. |
| Verify on-chain | When CoinGecko, Coinbase, and DEXTools disagree on FDV, the token contract on Etherscan is the ground truth. |
Table of Contents
- What does market cap actually tell you?
- What is FDV and how do aggregators calculate it?
- How to calculate market cap and FDV: a worked example
- FDV vs market cap: what each metric reveals and when to use which
- How to read the market cap / FDV gap and spot red flags
- How to investigate tokenomics before you buy
- Common limits of FDV and market cap that investors get wrong
- Where to find market cap and FDV numbers
- A practical checklist before buying any token
- How Blockchainreporter uses FDV in its reporting
- Sources
What does market cap actually tell you?
Market cap measures the value of tokens currently available to trade. Multiply the live token price by the circulating supply and you get the number. “Circulating” means tokens that have been issued and are not subject to lockups, vesting contracts, or other restrictions that prevent them from hitting the open market.
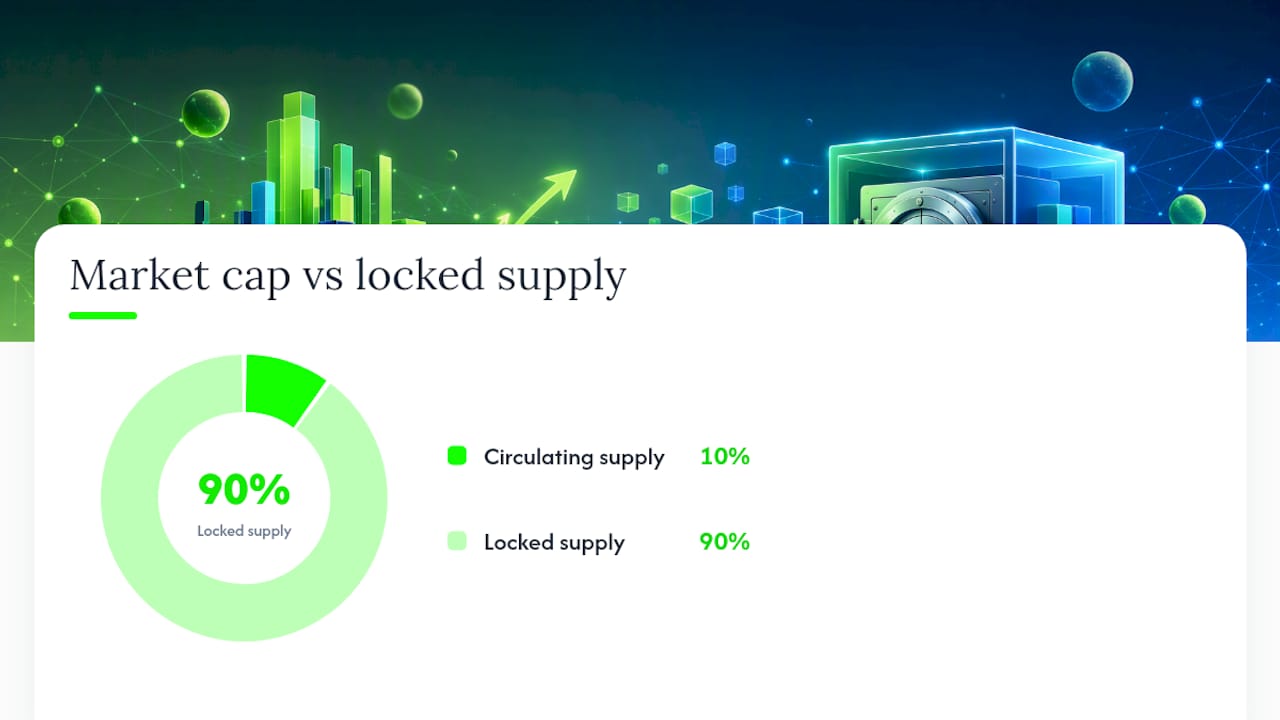
What market cap tells you well: the current market’s collective valuation of the freely tradable float. If a token trades at $2.00 with 50 million tokens in circulation, market cap is $100 million. That is the number most exchanges and aggregators display by default, and it is the figure most comparable to a traditional stock’s market capitalization.
What market cap can hide:
- Tokens held in team wallets under multi-year vesting schedules
- Investor allocations subject to cliff unlocks
- Treasury reserves that could be sold or burned
- Concentrated holder positions that distort the “freely circulating” label
A token can show a modest $100 million market cap while carrying $900 million in locked supply. The market cap number alone gives no warning of that.
What is FDV and how do aggregators calculate it?
Fully diluted valuation (FDV) answers a different question: if every token that will ever exist were circulating today at the current price, what would the entire project be worth? The formula is:
FDV = Price × Total (or Maximum) Supply
The distinction between “total supply” and “maximum supply” matters. Total supply counts all tokens minted so far, including locked ones. Maximum supply is the hard cap written into the protocol — the absolute ceiling. Coinbase defines FDV as Token Price × Total Supply and recommends treating it as a long-term risk-management metric rather than a current measure of project health.
Three major aggregators surface FDV:
- CoinGecko uses maximum supply where defined and displays a Market Cap / FDV ratio directly on each token page. CoinGecko warns that FDV can overstate short-term reality when large portions of supply remain locked far into the future.
- Coinbase shows FDV in its asset detail pages and frames it explicitly as a dilution-runway indicator.
- DEXTools displays both metrics side by side on token pair pages, making the gap immediately visible for DeFi tokens.
Two common misunderstandings worth clearing up: FDV is not a price target, and it is not a ceiling on where the token can trade. It is a snapshot of theoretical full-supply value at today’s price, nothing more.
How to calculate market cap and FDV: a worked example
Take a hypothetical token, Token X:
- Price: $1.00
- Circulating supply: 100 million tokens
- Total/maximum supply: 1 billion tokens
| Metric | Formula | Result |
|---|---|---|
| Market Cap | $1.00 × 100 million tokens | $100 million |
| FDV | $1.00 × 1 billion tokens | $1 billion |
| FDV / Market Cap ratio | $1B ÷ $100M | 10× |
| Float percentage | 100M ÷ 1B | 10% |
The FDV is 10 times the market cap. That means 900 million tokens are sitting somewhere — team wallets, investor lockups, ecosystem funds — waiting to enter the market.
A moderate FDV gap with around half the supply circulating is relatively low risk; dilution is limited. Larger gaps warrant a close look at the unlock schedule. Very wide gaps are a significant flag: if large amounts of tokens unlock into a market that cannot absorb them, the price may face sustained downward pressure. As Crypto, a token can look cheap by market cap and expensive by FDV simultaneously — the unlock calendar turns FDV into a preview of scheduled dilution.
FDV vs market cap: what each metric reveals and when to use which
Market cap answers “what does the market value today?” FDV answers “what would the market value if the full supply were already out?” They are not competing metrics — they answer different questions for different time horizons.
| Dimension | Market Cap | FDV |
|---|---|---|
| What it shows | Current value of circulating float | Theoretical value at full supply |
| Best for | Short-term trading, liquidity assessment | Long-term dilution risk, presale evaluation |
| Can hide | Locked supply, vesting schedules | Timing of unlocks, demand changes |
| Risk if used alone | Misses future supply pressure | Overstates near-term risk if unlocks are distant |
For a day trader focused on the next 48 hours, market cap and order-book depth matter most. For a long-term holder evaluating a new token launch, FDV is the number to anchor on. DirectionsMag’s guide reinforces that neither metric works well in isolation — combining them with unlock schedules and liquidity checks is what produces a usable picture.
How to read the market cap / FDV gap and spot red flags
The Market Cap / FDV ratio is the cleanest single number for a quick dilution check. Divide market cap by FDV:
- Ratio near 1.0 (float above 80%): Most supply is already circulating. Dilution risk is low.
- Ratio of 0.5 (float around 50%): Moderate risk. Investigate the unlock timeline.
- Ratio below 0.2 (float under 20%): High dilution risk. The FDV is more than 5× the market cap — treat this as a prompt to dig into the unlock schedule before committing capital.
Red flags to watch beyond the ratio:
- Large cliff unlocks within the next 6 months (team or investor tranches)
- Opaque or missing supply definitions in the project’s documentation
- Private-round allocations that represent 30% or more of total supply
- Thin liquidity relative to the size of upcoming unlocks
- Circulating supply figures that differ materially across aggregators
The gap alone is not proof of a problem. BlockMind’s practitioner guide makes the point clearly: the unlock schedule and holder structure determine whether an FDV gap is dangerous. A project with a 10× FDV gap but a gradual 5-year linear vesting schedule is materially less risky than one with the same gap and a 6-month cliff unlock for early investors.
How to investigate tokenomics before you buy
-
Verify supply definitions. Open the token’s page on CoinGecko or Coinbase and note whether FDV uses total supply or maximum supply. Then cross-check against the project’s own documentation or whitepaper. Discrepancies here are a signal to dig further.
-
Pull the unlock and vesting schedule. Most projects publish a token distribution table. Map the amounts and dates: when do team tokens unlock? When do investor allocations vest? A cliff unlock is a single large release on a specific date; a linear schedule releases tokens gradually. The cliff is the higher-risk structure.
-
Identify recipient categories and sell incentives. Team tokens and early investor allocations carry the highest sell pressure — these holders often have cost bases near zero. Ecosystem and treasury tokens are less likely to hit the market immediately. Separate the two categories when estimating real dilution risk.
-
Check liquidity depth. Use DEXTools to examine the order book depth on the primary trading pair. A $50 million unlock hitting a market with $500,000 in daily volume is a price shock waiting to happen. Liquidity depth converts a theoretical unlock into a real sell-pressure estimate.
-
Verify on-chain supply data. Use a block explorer like Etherscan to confirm the token contract’s total minted supply, check for burn events, and identify large wallet concentrations. The Blockchainreporter guide to blockchain explorers walks through exactly how to read contract data for supply verification.
-
Cross-check across aggregators. Pull FDV from CoinGecko, Coinbase, and DEXTools. If the numbers differ, the aggregators are using different supply definitions. When they conflict, prioritize the primary contract data from the block explorer.
Pro Tip: *Weight near-term unlocks far more heavily than distant ones.
Common limits of FDV and market cap that investors get wrong
FDV’s biggest flaw is its static price assumption. It takes today’s price and multiplies it by total supply as if nothing will change. In reality, releasing 900 million new tokens into a market that currently absorbs 100 million would almost certainly push the price down. BlockMind’s analysis notes that FDV ignores timing, probability, and incentives — a full-supply release at today’s price is a theoretical construct, not a forecast.
Market cap carries its own blind spots:
- It is not the amount of money invested in a project. A token with a $500 million market cap did not necessarily receive $500 million in capital inflows.
- It says nothing about protocol revenue, token value capture, or the project’s ability to sustain demand.
- A high market cap can reflect concentrated holder activity rather than broad market participation.
Neither metric captures fundamentals. A token can have a low FDV gap and still be a poor investment if the protocol generates no revenue and token holders have no claim on it. Using FDV and market cap as the only filters is like judging a company solely by its share count and price — the balance sheet, income statement, and competitive position all still matter.
Where to find market cap and FDV numbers
CoinGecko is the most detailed free source. Each token page shows market cap, FDV, and the Market Cap / FDV ratio. CoinGecko uses maximum supply where it is defined; when a token has no hard cap, it falls back to total supply. The methodology toggle is visible in the token’s “Info” section. CoinGecko’s FDV documentation explains exactly how the platform handles supply definitions.
Coinbase displays FDV on individual asset pages alongside market cap. The framing is explicitly long-term: Coinbase positions FDV as a dilution-runway indicator rather than a valuation benchmark.
DEXTools is the go-to for DeFi tokens that may not appear on the major aggregators. It shows market cap and FDV side by side on pair pages, along with liquidity depth and volume data — all in one view. DEXTools’ guide also explains how to interpret the ratio for newly launched tokens.
Etherscan and other block explorers are the ground truth. They show the token contract’s total minted supply, any burn events, and large wallet holdings. When aggregator numbers conflict, the contract data wins.
One practical note: aggregators refresh at different intervals and pull price from different sources. A fast-moving token can show meaningfully different FDV figures across platforms within the same minute. Always note the timestamp and price source when comparing numbers.
A practical checklist before buying any token
- Find the supply denominators. Record circulating supply, total supply, and maximum supply from CoinGecko or the token’s documentation.
- Calculate the Market Cap / FDV ratio. Below 0.2 means more than 80% of supply is still locked — treat it as high-dilution territory.
- Map the unlock schedule. Identify cliff dates, vesting end dates, and the recipient categories for each tranche.
- Estimate near-term sell pressure. Divide the next 90-day unlock amount by average daily volume. A ratio above 10× is a serious liquidity concern.
- Check holder concentration. Use Etherscan to see whether the top 10 wallets hold more than 50% of circulating supply. High concentration amplifies sell-pressure risk.
- Verify numbers across sources. Pull FDV from CoinGecko, Coinbase, and DEXTools. If they differ, go to the contract.
- Size your position to the dilution risk. A token with an FDV 8× its market cap and a near-term cliff unlock warrants a smaller position than one with 70% of supply already circulating. Presale investors comparing early-stage valuations should apply this framework before committing capital.
- Add macro context. Supply unlocks hitting during a broad market downturn create more price pressure than the same unlock in a bull market. Blockchainreporter’s real-time market coverage tracks the macro conditions that affect how the market absorbs new supply.
For a token with FDV 8× market cap and a cliff unlock in 60 days, a reasonable adjustment is to cut intended position size by half and set a price alert for the unlock date. If the price holds through the unlock, that is evidence of genuine demand absorption — and a potential signal to add.
How Blockchainreporter uses FDV in its reporting

Blockchainreporter treats FDV and market cap as a paired signal, not a single number. When covering a new token or project, reporters verify supply definitions directly against the token contract before publishing any valuation figure — aggregator numbers get a second check when the token is newly launched or when supply definitions are ambiguous. The platform’s real-time price tracking feeds into FDV calculations so that the figures in any article reflect the most current price available at time of publication.
For readers who want to stay current on supply events, unlock schedules, and how they interact with live price data, Blockchainreporter publishes ongoing coverage of tokenomics developments across major and emerging tokens.
This article is for general informational purposes only and does not constitute financial or investment advice. Always verify current data with primary sources and consult a qualified professional before making investment decisions.
Sources
- What is a Fully Diluted Valuation (FDV) in crypto? | Coinbase
- What Is Fully Diluted Valuation (FDV) In Crypto? | CoinGecko
- Crypto Market Cap vs FDV: Formulas, Traps, and a Better Comparison — BlockMind Docs
Cross-check at least two sources before recording a supply figure, and always prefer primary contract data when definitions conflict.
This article is general information, not a substitute for advice from a qualified financial advisor. Consult a qualified financial professional about your own circumstances before acting on anything here.
Recommended
- Crypto Market Today | Prices, Trends & Analysis
- Top Crypto Presale 2026: Investors Compare PredictMarkets ($PREDICT) To Polymarket’s $8B Valuation Before Public Launch
- Crypto News Today | Top Headlines & Updates