


Bitcoin was exactly where it spent most of last trading week at the end of the weekend, with $64,409 as resistance and $64,253 as support. Bitcoin traded at $64,366 on July 26.
A trading range of this size is practically nonexistent.
Zooming out makes the image only slightly less crowded: Bitcoin has been stuck in a vicious cycle for almost three weeks, failing to break out of the $63,000-$66,000 region, and stubbornly refusing to fall below the low $60s despite many chances to do so.
The token gained over one per cent on Monday to trade above $65,250, but still below the top of the range of about $66k.
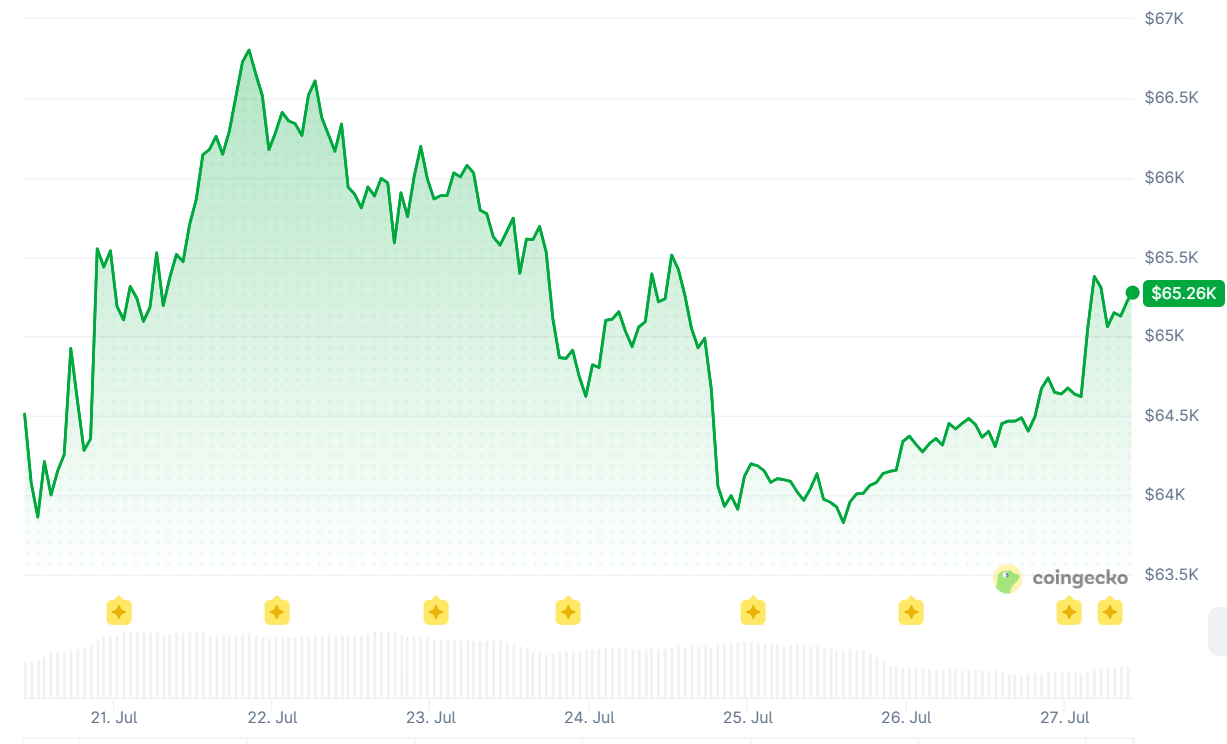
The storyline here is the reluctance to go in any direction.
Currently, Bitcoin is being impacted by two seemingly incompatible factors: first, the Federal Reserve has decided against cutting interest rates, and second, a war in the Middle East is pushing oil prices towards $100 per barrel, which is bad news for risky assets.
On the other hand, every time Bitcoin's value drops, there is an ETF sector that grudgingly keeps reinvesting funds into the cryptocurrency.
Neither side has a distinct advantage.
Last week, leveraged positions worth $312 million were liquidated, but the market has done nothing to move the needle.
The Week in Flows: Institutions Are Undecided, Not Absent
Not the price, but ETF activity is the clearest barometer of mood, and it reversed course twice last week.
The seven sessions before July 23 saw a remarkable surge of roughly $1 billion into spot Bitcoin ETFs.
On July 24, however, net outflows of $225–240 million brought this encouraging trend to a sudden halt.
A further $240 million went down the drain on July 25, mostly as a result of BlackRock's IBIT, which dropped more than $212 million in a single trading session.
The net weekly total was a respectable $33 million, which is positive in and of itself but is a marked decline from $75 million the week before and a drop in the bucket when contrasted with the recent receipt of one billion dollars.
Looking at things from a broader perspective makes it clear that the vulnerability is not an accident but is built into the architecture itself.
Five days of positive $154.5 million, one month of negative $1.83 billion, three months of negative $3.91 billion, and six months of negative $3.07 billion make up IBIT's flow ledger, which presents an intriguing story via six numbers.
The US spot Bitcoin ETF complex has seen net outflows of about $5.4 billion so far in 2026, which is a big change for products that have been available since 2024 and have influenced the story of institutional adoption.
After recovering from a low of about $74.4 billion, the complex's total net assets are now at $80.9 billion.
When contrasted with the mood in the latter quarter of 2025, this number does show a considerable drop.
Since the creation and redemption of ETFs now function as a mechanical driver of spot prices, rather than just an emotional one, this is more important than simply changes in headline prices.
According to studies done this year, approved participant flows are responsible for almost 45% of the weekly price variation of Bitcoin.
It appears that the daily flow ledger serves a purpose beyond expressing market mood, more like a supplementary order book.
Ignoring the subjective values of individual traders, the systematic selling that caused $2.73 billion to depart over 10 sessions in late June was evident in the market.
On the return voyage, the same logic operates in the other way, explaining why Bitcoin's spikes this month seem more like hesitant mean-reversion than a sustained trend.
In the five sessions before July 23, an inflow of $211 million was recorded, marking a significant period of activity for Ether ETFs.
On July 24, nevertheless, a $70.6 million drain put an abrupt end to this pattern.
The fact that both asset classes saw a change on the same day is consistent with other events that happened that week and suggests a single macro driver rather than a rotation involving individual assets.
What the Charts Are Actually Saying
From a technical perspective, Bitcoin presents a landscape of conflicting indicators that create a scenario where taking action may seem unwarranted.
The daily RSI is currently hovering around 50 - a perfectly neutral reading from the oscillator- and this has remained consistent for more than a week.
This indicates that momentum has stabilised, showing no signs of bearishness. The 14-day ATR of approximately $1,680 (2.6% of spot) indicates that realised volatility has contracted, even with ongoing headline risks - Fed, Iran, CLARITY - remaining high, a discrepancy that usually doesn't persist.
When compared to the day-to-day perspective, the larger framework offers more insight.
In the past fifteen days, the price of bitcoin has fluctuated between $61,769 and $66,910.
According to the Fibonacci retracement for this range, the market's centre of gravity, which is represented by the 50% level, is at $64,340.
This level is near the price at the end of the week.
Reclaiming and maintaining a position above the 61.8% retracement at $64,946 will pave the way towards the $65,700-$65,800 range.
This level has formed a robust resistance zone with the 50-day EMA and upper Bollinger Band, which has thwarted multiple attempts since early July.
To counteract the "lower high" pattern that has been in place since Bitcoin's failed effort to hit $70,000 in June, the bulls must break through the $66,900 to $67,000 region, which is a critical resistance level.
According to TradingView, on the downside, the crucial level to keep an eye on is $61,400-$61,800.
This zone has consistently been maintained during every test since the low at $57,750 on July 1, and it is also the bottom of the current swing range.
If the price drops further below this level, especially with increased buying pressure, it might go all the way to $58,300 or, even worse, the low-$55,000s, where a bigger head-and-shoulders pattern on the long-term chart would be confirmed.
Although the short-term outlook seems neutral, Bitcoin is still categorised as negative in longer-term technical analyses within that timeframe.
Just a friendly reminder that while mood has improved thanks to this month's stability, the general trend has remained the same.
The total maximum pain level stays below $66,000, which is consistent with the options strategy that suggests a range-bound market.
Leveraged longs have not recovered the crowding observed before the collapse in June, as the funding on perpetuals continues near neutral, despite the put/call ratio increasing from its lowest position in many months.
Bitcoin isn't as heavily leveraged as it usually is in the days leading up to a Fed meeting, which is perhaps the most encouraging discovery from the data.
Crypto Bulls Bet on Ceasefire
Over the weekend, crypto experts were predicting a possible recovery on the belief that the Iranian dispute was drawing to a close and that oil prices would fall as a result.
But recent diplomatic events pointed differently.
Analyst Michaël van de Poppe predicted a successful week, stating on Sunday that Iran had refrained from striking and the US had refrained from attacking for days.
As a result, Brent fell 10% to $87. "Bigly" (he added), this will help Bitcoin and the cryptocurrency market.
Bitcoin has yet to surpass the crucial threshold, but the MNFund Founder anticipated it would do so with the decline in oil prices.
He mentioned that the ability of BTC to maintain a value of $65,000 during a period of intense market activity demonstrated a strong underlying resilience.
"Party time" is on the horizon once you surpass the resistance zone, he noted.
Similar thoughts were expressed by analyst Ted Pillows, who said that oil prices might fall sharply during a market rise if the halt continues.
The discussions were moving forward, but they were not aligned with what the bulls were betting on.
The US and Iran responded on Sunday to a proposal put out by Pakistan and Qatar, which alleged that Iran would quickly reopen the Strait of Hormuz in return for the removal of sanctions on Iranian oil sales and Washington's port blockade, according to Sunday's Al Arabiya report.
A media report quoting a source showed that Iran has temporarily halted talks instead of completely withdrawing.
Also, to speed up the reopening process, Tehran informed Pakistani authorities that it would not be accepting their proposal to build a new route across the strait.
What Other Technical Readings Show
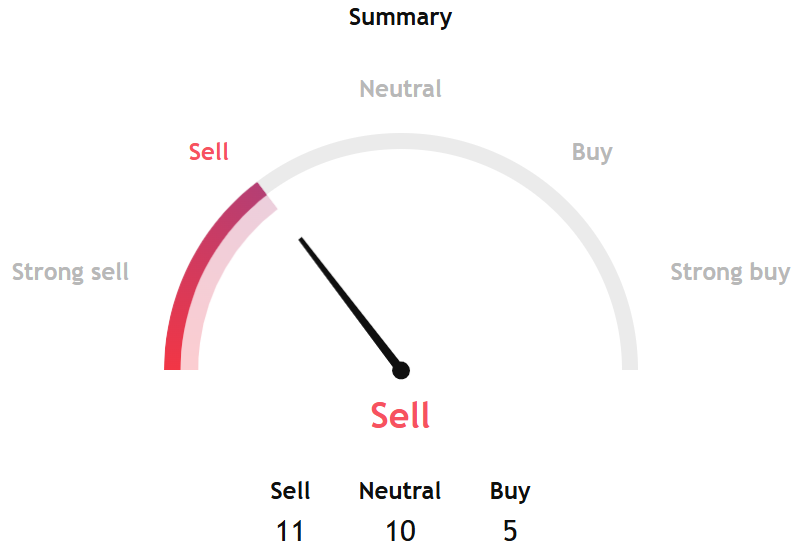
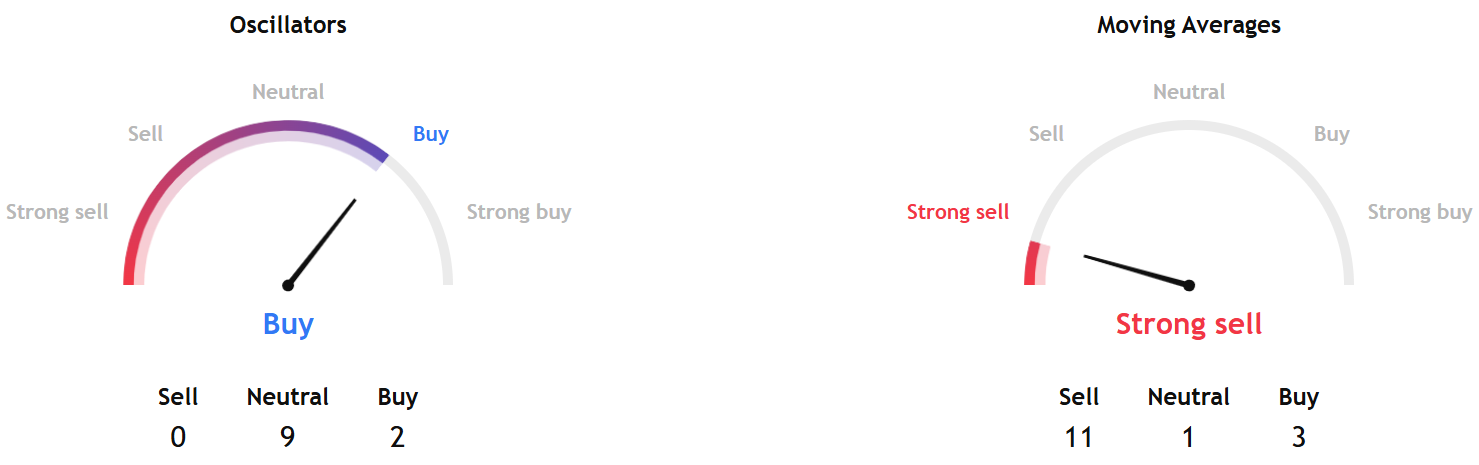
TradinView's technical analysis overview for the coming week based on key data from moving averages, oscillators, and pivots continued to point to a sell signal.
While the long-term indicators of moving averages align with the overall analysis, Oscillators, built for short-term trading and momentum analysis, pointed to a buy signal.
Separately, InvestTech's Algorithmic Overall Analysis and one- to six-week recommendation gave a hold signal.
The research noted, "Bitcoin has broken the floor of the rising trend channel in the short term, which indicates a weaker initial rising rate. The token is between support at $64,300 and resistance at $66,000."
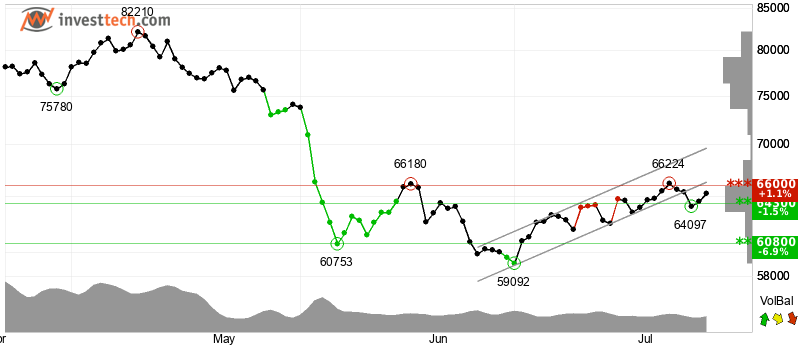
InvestTech added, "A definitive break through of one of these levels predicts the new direction. The currency is assessed as technically slightly positive for the short term."