



On Sunday, Brent crude surpassed $90 per barrel, marking its first close above that level since mid-June.
This comes after a weekend in which a strike on Jordan’s Muwaffaq Salti Air Base by an Iranian ballistic missile and drone killed two US service members and left a third missing.
The war resumed on July 7.
To this, Bitcoin just shrugged.
As US gas prices drew near $4 per gallon and Brent futures reversed due to supply-risk pricing, Bitcoin was trading just below $64,700, about unchanged from a week ago.
The real market story is about that difference.
Crude oil, an asset susceptible to geopolitical risks, has been behaving predictably over the first half of the deadliest conflict in the Middle East this decade.
Bitcoin, the asset that an entire industry has dedicated years to promoting as "digital gold," is not.
The War, In Numbers
In what the Pentagon has called Operation Epic Fury, which began on February 28, the United States and Israel carried out strikes against Iranian military and nuclear sites, killing Iran's supreme commander and starting the fight.
In response, during the peak of the war, on March 9, Brent rose to $126.29, marking the pinnacle of the cycle.
However, prices began to fall due to a series of increasingly precarious ceasefires.
The trend has been systematic: ceasefire, tanker traffic picks up, Brent approaches $70; provocation, blockade reimposed, Brent surges 5-15% in a single session.
A memorandum of understanding issued on June 18 marked the fourth effort to reduce tensions and saw temporary success - Brent spot prices averaged $85 in June before dropping below $70 on July 1, according to the EIA's Short-Term Energy Outlook, nearing pre-war levels.
It continued for a duration of three weeks.
On July 6-7, Iran targeted three commercial vessels in the Strait, prompting the US to respond with strikes on over 80 Iranian military targets.
Trump announced that the ceasefire was "over.
What transpired was the ninth consecutive night of US strikes as of this weekend, a reestablished naval blockade on Iranian ports, an assault on Kuwaiti desalination infrastructure, and now the first confirmed US combat fatalities of the renewed phase - raising the war's American death toll to 17.
Iran's deputy foreign minister has announced that Tehran has completely halted its commitments under the June memorandum of understanding.
This is not an isolated incident.
In the past five months, we have witnessed five cycles of escalation and de-escalation, and with each round, the war premium on oil has been dynamically adjusted.
Because of this, $90 is more than simply a round figure; it represents an important milestone in a long-term trend.
According to UBS and other experts, the variables that were able to keep oil prices below March's highs, such as reduced Chinese imports, coordinated releases from strategic reserves, and enough commercial stocks, are now obviously waning.
If the Strait is successfully sealed, prior conflict-era bank projections indicate a possible return of $120.
Bitcoin's Muted Correlation
Crypto's response to every round of this conflict has been very minimal and steady.
Bitcoin, which rose to a monthly high of $65,500, slid almost 2% to under $65,000 after the US hit more than 80 Iranian targets on July 7.
The market saw about $350 million in leveraged liquidations.
The next day, when Trump pronounced the truce dead, BTC fell from above $64,600 to $62,115, a move of comparable size, while oil surged by around 7%.
As CENTCOM ran its fourth attack wave close to Hormuz on July 13, Bitcoin fell less than 2% in response to a 4% increase in gasoline prices.
The ratio has been consistent throughout the conflict: oil goes 2-4 times farther than Bitcoin on the same headline.
This discrepancy, which in 2021 would have been interpreted by Bitcoin enthusiasts as positive "hedge" behavior, now reads more like apathy.
Ether has proven to be resilient by staying above $2,000 even in the face of extreme volatility.
The consistent dominance of Bitcoin, which has maintained a range of 58.5–59%, suggests that during times of uncertainty, capital tends to move into BTC rather than leaving the crypto space altogether.
This is a real signal, though it may not be as big as what the headlines suggest.
Midway through July, the Fear & Greed Index registered 26, placing it squarely in the "fear" zone.
On the other hand, spot Bitcoin and Ether ETFs halted an eight-week outflow trend the same week, suggesting that institutional purchasers are trying to capitalize on the fall by adding more coins rather than selling them.
Bitcoin peaked at $126,198 in October 2025 and is now trading between $62,000 and $65,000, a fall of about 50% from that peak and about 31% year-to-date, compared to the 9% gain experienced by the S&P 500.
This larger figure encompasses the entire scenario.
Meanwhile, central banks' purchases and genuine demand for gold as a safe-haven asset have caused its price to skyrocket amidst the continuing turmoil.
Despite the crisis, the asset that was touted as a hedge against inflation and geopolitical tensions has fallen behind stocks and the physical metal it sought to digitally replace.
Why The Hedge Narrative Broke
According to CryptoSlate's reporting on studies conducted by VanEck and JPMorgan, an explanation based on structural considerations, rather than emotional responses, is becoming more popular among institutional desks.
There has been a shift in the power dynamic around the marginal price of Bitcoin due to ownership of spot ETFs.
In a market where rate-sensitive, macro-driven tactics are becoming more influential, the effect is similar to a "liquidity sponge": the market expands when the global money supply and risk appetite go up, and contracts when real rates go up, or liquidity gets tight, regardless of what happens in the Strait of Hormuz.
Instead of war news, monetary policy is now the main element impacting the market.
That claim can be evaluated, and the data we have so far supports that assessment: the newly appointed chair of the Federal Reserve, Kevin Warsh, is presiding over a conflict-driven inflation surge (the three-week increase in Brent prices from $70 to $90 is a classic example of a supply-side price increase), and market sentiment suggests that the Fed will likely maintain interest rates this month with a 93% likelihood, according to CME FedWatch, and an increase with a 14% chance.
Regardless of the outcome of the debate, the researchers' methodology predicts that Bitcoin would fall further as a result of rate changes if oil prices keep going up and the probability distribution becomes more aggressive.
It stands in stark contrast to a plan to reduce geopolitical risks and symbolizes the evolution of geopolitical uncertainty as a result of monetary policy before it affects the value of Bitcoin.
The evasion of sanctions is a fascinating story that is playing out beneath the surface of the price movements.
For a long time now, compliance teams have been simulating the exact same scenario: a protracted war with significant sanctions against a state actor that is becoming economically isolated.
The OFAC apparatus of the Treasury has already shown that it is prepared to move quickly against firms that help Iranian oil restrictions to be circumvented using cryptocurrency channels.
It's crucial to keep an eye on it as the scenario unfolds, even if it's a more subtle element than the current price.
The Setup Bulls Are Pointing To
The cycle-pattern argument will inevitably surface again; it's important to give it due consideration in its own right.
On a handful of occasions throughout its history, Bitcoin's price has fallen below its cycle peaks.
However, each time this has happened, it has been followed by substantial recoveries.
For example, in early 2015, it fell below the 2013 high of around $1,150 before surging into 2017; in late 2022, it fell below the 2017 peak of around $19,660, but then it rose to over $126,000 in October 2025.
At both bottoms, the same conditions prevailed: near-capitulation sentiment, retail apathy, and a macroeconomic background (rate increases in 2022, war-driven inflation risk today) that made the asset look uninvestable.
From a purely pragmatic point of view, both stories are true simultaneously.
The fact that Bitcoin is linked to the liquidity of central banks suggests that interest rate forecasts have a greater impact on its value than short-term geopolitical events.
In light of this, the continued fighting in Bushehr is less of a danger to Bitcoin than an extra increase in inflation caused by crude prices.
Nevertheless, the characteristics that caused the past two major rallies-a 50% drop from the all-time high, institutional purchasing when ETF withdrawals reversed, and huge accumulation by large investors during downturns—are identical to this one.
Rather than direct events from Tehran, the approaching month of CPI data, FOMC signals, and the continuing situation in the Strait will greatly impact Brent's movement towards or away from $100.
$69K & Higher?
Once again, Bitcoin is aiming for its previous high of $69,000. According to crypto expert Ali Martinez, the top digital currency is following a pattern that has led to significant price gains of more than 7,500% and 550% in prior market cycles.
On the other hand, clear signs are emerging from on-chain data, which could indicate a major change is on the horizon.
Martinez points out that there have been very few instances in Bitcoin's history where the price has fallen below the all-time high of the preceding cycle. However, each time this has happened, it has led to some of the best purchasing opportunities in the market.
Bitcoin fell below its previous high of about $259 in the 2015 cycle, but then surged over 7,500% in the succeeding bull market.
After the 2021 cycle, a similar pattern surfaced. After dipping below $19,660 in late 2022, Bitcoin rebounded by over 550% to an astounding $126,198 in October 2025, surpassing its previous all-time high.
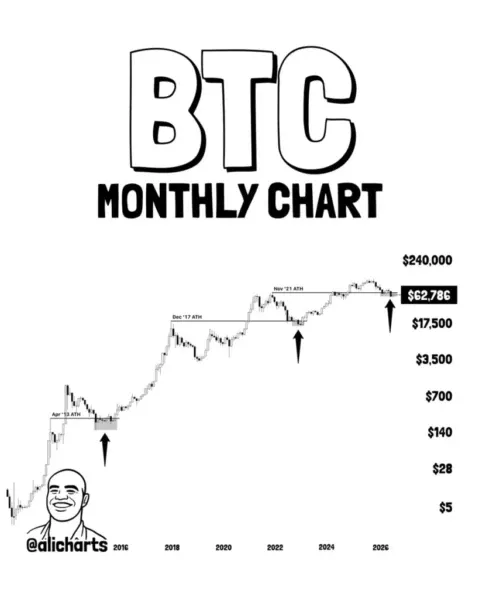
The same old pattern of events is playing out before our eyes once again. Having hit a high of about $69,000 in 2021 in June, Bitcoin has been trading just below that level ever since.
If Bitcoin can stay above this level for the foreseeable future, Martinez thinks it would mean the cryptocurrency is finally breaking out of its bear market and onto a more hopeful upward trend.
Bulls Take Charge Onchain
Following the recent rally from $57,000, the latest Short-Term Holder Cost Basis Distribution Heatmap from Glassnode shows that many new investors joined the Bitcoin market between $62,000 and $65,000.
Since many Bitcoin holders already own Bitcoin at these prices, this creates a strong support area.
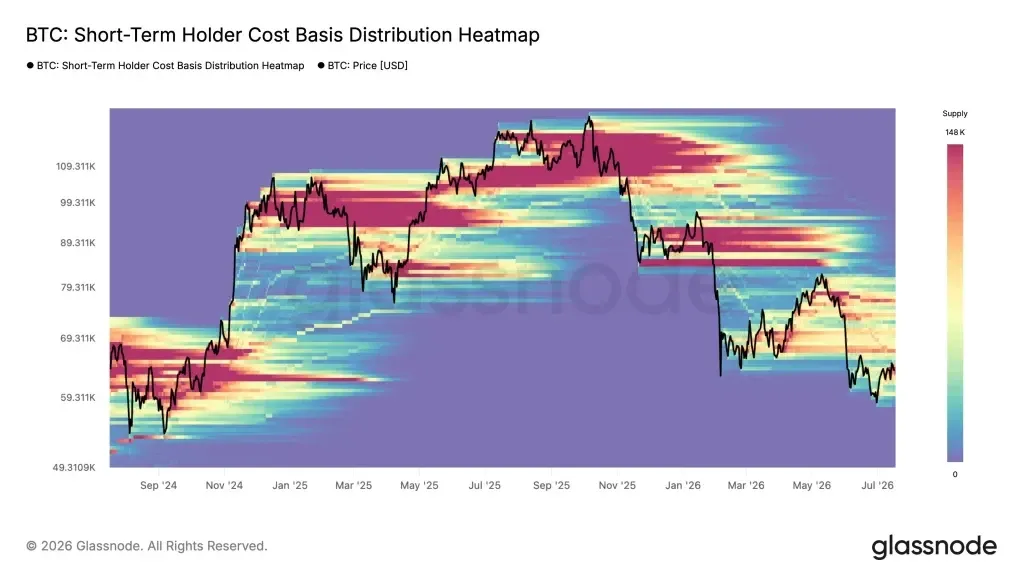
Nonetheless, Glassnode cautions that a significant portion of this purchasing occurred towards the conclusion of the latest surge. If Bitcoin fails to surpass the $66,000 mark, new investors may begin to realize their gains, which could heighten the likelihood of a short-term decline.
Bitcoin is still following its well-documented four-year cycle, according to crypto expert Rekt Capital. His prediction is that 2026 will be a bear market year, whereas 2025 was the apex of the bull market.
According to the expert, the final bottoming phase before a new Bitcoin bull cycle begins would occur in 2027.
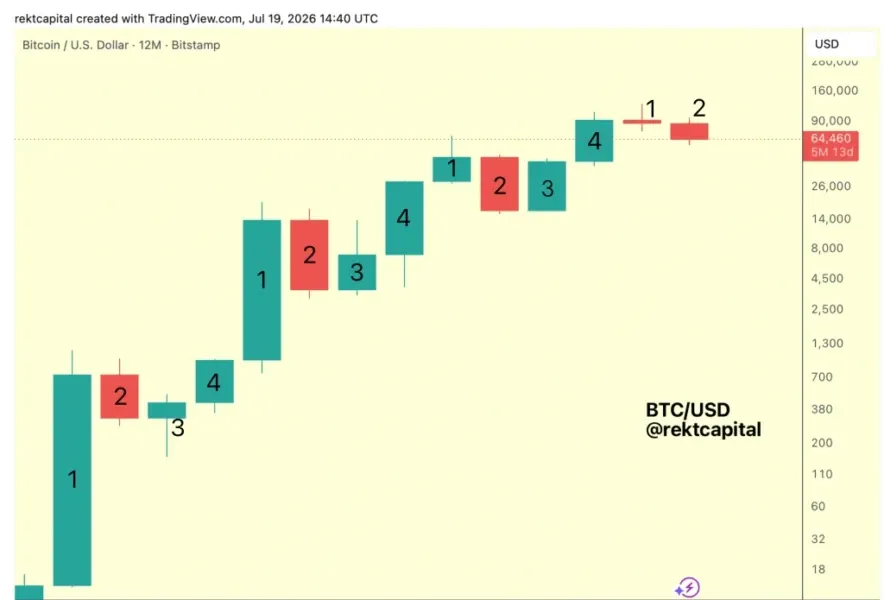
Despite the current downturn, experts suggest that Bitcoin remains aligned with numerous patterns observed in earlier market cycles.
Currently, Bitcoin is priced at approximately $64,800, with market participants closely monitoring its ability to recover to $69,000 and establish its forthcoming significant trajectory.
What Other Technical Readings Show
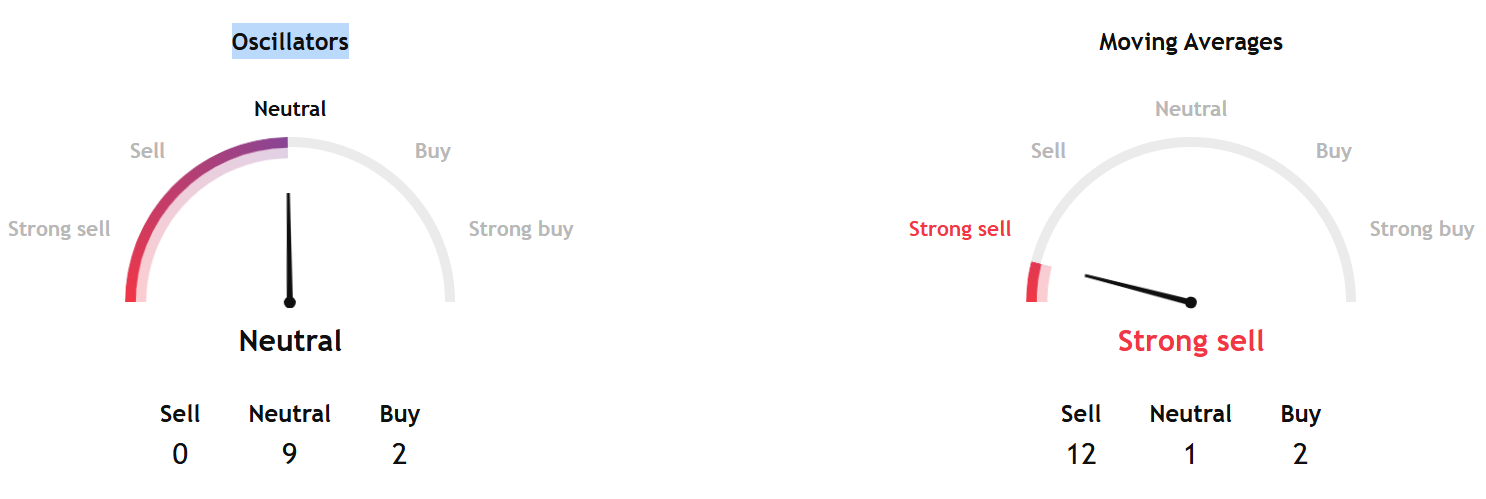
TradingView's technical analysis overview for the coming week, based on key data from moving averages, oscillators, and pivot points, suggests a sell signal.
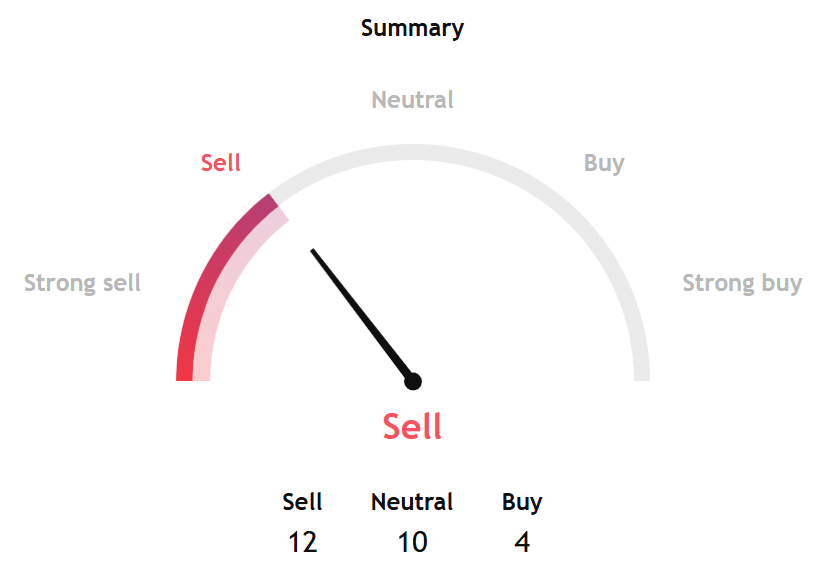
Oscillators, primarily short-term tools used to gauge momentum and identify overbought or oversold conditions, point to a neutral sign, while the long-term readings of moving averages still show a strong sell signal.
Separately, InvestTech's Algorithmic Overall Analysis gave a weak negative score.
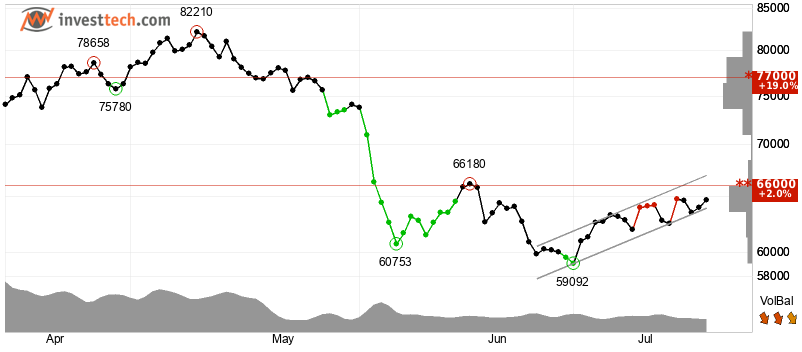
The research's one-to-six-week recommendation was hold.
InvestTech said, "Bitcoin shows strong development within a rising trend channel in the short term. Rising trends indicate that the currency experiences positive development and that buy interest among investors is increasing. The token is approaching resistance at 66000 points, which may give a negative reaction."
"However, a break upwards through $66,000 will be a positive signal. Negative volume balance indicates that volume is high on days with falling prices and low on days with rising prices, which weakens the currency. The token is overall assessed as technically neutral for the short term," added the research.