



Bitcoin is trading at $62,999.45, up 5.43% over the past week as it reclaims the 200-week moving average near $62,457 — a level that flipped from resistance to support just days after Strategy adopted a new capital framework permitting Bitcoin sales for the first time in the company’s history. The move caps a sharp reversal from the $59,486 level BTC held at the end of June.
Key Takeaways
- BTC trades at $62,999.45, up 5.43% on the week, after reclaiming the 200-week moving average at $62,457
- Strategy adopted a “Digital Credit Capital Framework” on June 29 authorizing up to $2 billion in buybacks, formally opening the door to Bitcoin sales for the first time since the company began accumulating
- MSTR stock rose over 12% on the announcement even as the Bitcoin-specific implication is a modest structural negative
- A weakening US dollar and easing rate-hike expectations have removed two of the headwinds that pushed BTC below $60,000 in late June
- $65,000 is the next resistance level if the current reclaim holds; a failure to hold $62,457 would reopen the $58,000–$60,000 zone
Bitcoin Price Metrics
| Metric | Value |
|---|---|
| Price | $62,999.45 |
| 7-Day Change | +5.43% |
| Market Cap | $1.26 trillion |
| 24h Volume | $20.61 billion |
| All-Time High | $126,173.18 (Oct 14, 2025) |
| ATH Drop | ~50% |
| Circulating Supply | 20.05M BTC |
Source: CoinMarketCap , Binance
Bitcoin Price Analysis: Reclaiming the 200-Week Moving Average
Bitcoin’s price structure has shifted meaningfully since late June. BTC spent the final week of the month grinding below $60,000, briefly touching $57,800 before reversing. The recovery has since carried price back above the 200-week moving average at $62,457 — a level that had capped every rally attempt during the prior sell-off and now needs to hold as support for the reversal to be considered structurally confirmed rather than a short-covering bounce.
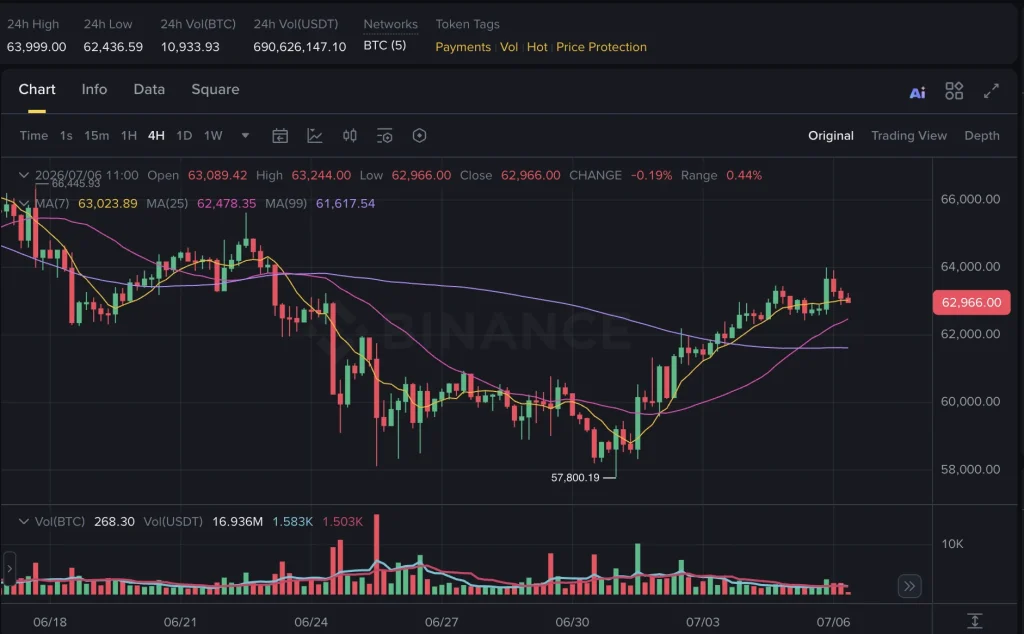
Volume has picked up alongside the move, with 24-hour trading volume up 17.5% and daily candles showing consistent green closes since July 3. The 7-day and 25-day moving averages have both turned upward, with the 7-day average at $63,038 now sitting just above spot price.
Support and Resistance Levels
| Level | Price | Significance |
|---|---|---|
| Resistance 2 | $65,000 | Next major target if the 200-week MA reclaim holds |
| Resistance 1 | $63,800 | Near-term resistance from recent price action |
| Current Price | $62,999.45 | — |
| Support 1 | $62,457 | 200-week moving average; must hold to confirm reversal |
| Support 2 | $58,000–$60,000 | Late-June range; a break below reopens cascade risk toward $54,000–$56,000 |
What Could Happen Next
Bullish scenario: BTC holds $62,457 and clears $63,800, opening a path toward $65,000 as ETF flows stabilize and dollar strength continues to ease.
Base scenario (most likely): Bitcoin consolidates between $61,000 and $64,000 through mid-July as markets digest Strategy’s new sell framework and await clearer ETF flow data.
Bearish scenario: A break below $62,457 reopens the $58,000–$60,000 zone; a further breakdown risks a cascade toward $54,000–$56,000, a zone flagged after a $10.5 billion options expiry weakened the $60,000 put wall that had previously acted as a floor.
Strategy’s Sell Framework: From “Never Sell” to a $2 Billion Buyback Plan
The most significant development shaping Bitcoin’s narrative isn’t technical — it’s structural. On June 29, Strategy, the largest corporate Bitcoin holder, announced a “Digital Credit Capital Framework” authorizing up to $2 billion in stock buybacks, split evenly between MSTR and STRC repurchases. Critically, the framework permits the company to sell Bitcoin to fund its US dollar reserve, support preferred dividends, and finance the buybacks.
For nearly four years, Strategy’s identity rested on a “never sell” posture toward its Bitcoin holdings. Formalizing a sell program, even within defined limits, shifts that narrative from permanent accumulator to strategic seller, introducing a potential new source of sell-side supply from the market’s single largest corporate holder. Equity markets welcomed the capital discipline — MSTR shares rose more than 12% on the news — but the Bitcoin-specific implication is viewed as a modest structural negative, particularly given Strategy’s valuation had fallen below the value of its BTC holdings prior to the announcement.
Why Bitcoin Is Recovering
Bitcoin’s bounce off $57,800 aligns with an easing of the macro headwinds that drove the late-June decline. The US dollar’s rally — which had pushed the Japanese yen to a 40-year low and pressured dollar-priced Bitcoin — has moderated, removing one source of downward pressure. Softer-than-expected inflation data has also reduced the odds of further Federal Reserve tightening. Analysts at Yield Basis have pointed to a further forward-looking catalyst: Bitcoin’s growing tendency to trade independently of traditional catalysts could set up institutional reallocation from AI-sector trades into Bitcoin as a diversification play, particularly if AI valuation concerns intensify — though this remains a potential future driver rather than a current one. For broader market context, see Crypto Market Today .
Bitcoin ETF Flows Remain the Key Variable
Spot Bitcoin ETF flows remain the dominant swing factor for price direction. Outflows persisted through much of June, with annual ETF Bitcoin holdings growth stalling near zero — a trend that, if reversed, would likely be the clearest signal of sustained institutional re-engagement. Until flow data turns decisively positive, the current reclaim of $62,457 remains a technical development that has yet to be confirmed by institutional capital.
Bitcoin Price vs Other Major Cryptocurrencies
At a $1.26 trillion market cap, Bitcoin remains more than 17 times larger than Ethereum , the second-largest cryptocurrency, and its price action continues to set the tone for the broader market. Where XRP trades on regulatory catalysts and Ethereum on network upgrade activity, Bitcoin’s price is now shaped primarily by the interplay between corporate treasury behavior — including Strategy’s shifting posture — and spot ETF flow data. For the latest developments across the sector, see Bitcoin News Today .
Summary Table
| Metric | Bitcoin (BTC) |
|---|---|
| Price | $62,999.45 |
| Market Cap | $1.26 trillion |
| 24h Volume | $20.61 billion |
| ATH | $126,173.18 |
| Supply Cap | 21 million (fixed) |
| Consensus | Proof-of-Work |
Compare Crypto Prices Today
| Asset | Price | 24h Change |
|---|---|---|
| Bitcoin (BTC) | $62,999.45 | +0.22% |
| Ethereum (ETH) | $1,778.33 | -0.49% |
| XRP | $1.1463 | +0.47% |
| Solana (SOL) | $81.10 | -1.18% |
| BNB | $585.36 | +1.74% |
| TRON (TRX) | $0.3279 | +0.64% |
Where to Buy Bitcoin
Bitcoin can be purchased on major centralized exchanges including Binance, Coinbase, Kraken, KuCoin, Gate.io, and OKX. Long-term holders typically move BTC to self-custody wallets rather than leaving it on an exchange.
This article is for informational purposes only and does not constitute financial advice.