



Bitcoin’s daily chart is flashing what John Bollinger calls “a little classic technical analysis”: a well-formed base followed by a Bollinger Band Squeeze and an upside breakout that puts $100,000 and roughly $107,000 in view, so long as price can hold the move and avoid slipping back into the prior range.
Bitcoin Rebound To $107,000 Next?
“Near perfect base for BTCUSD with a Bollinger Band Squeeze and breakout,” Bollinger wrote alongside the chart. “First upside target 100,000, second ~107,000, third ??? If we fail here it is back into the trenches.”
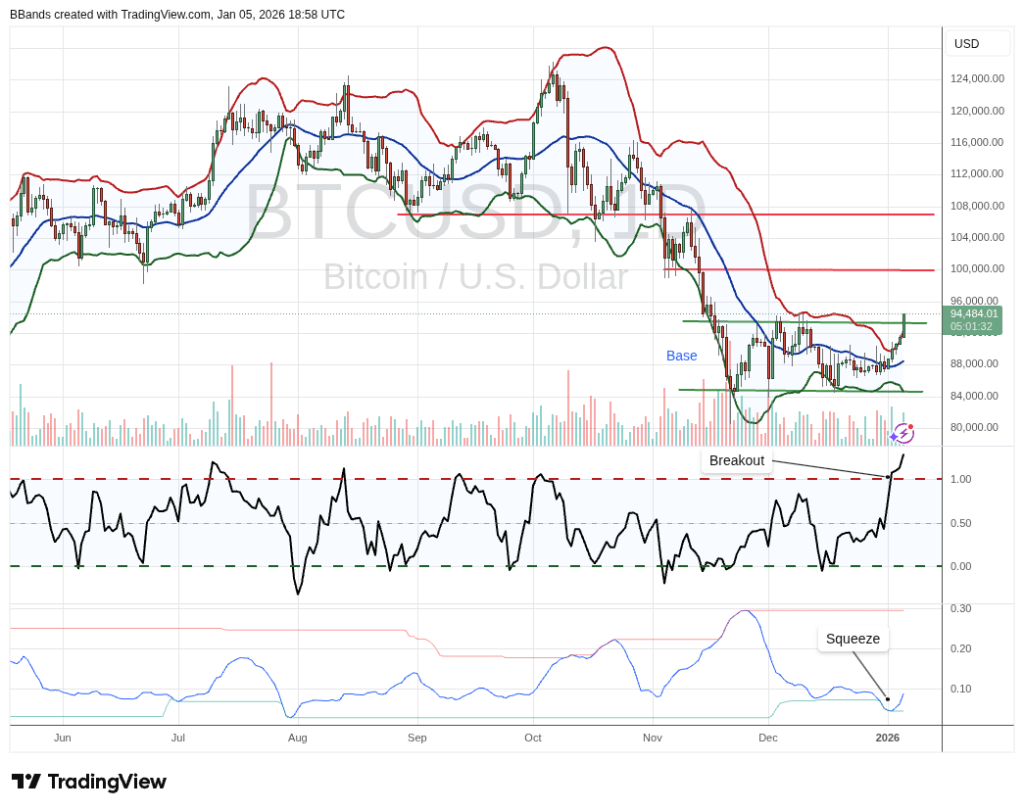
On the daily timeframe, BTC spent much of the late-year period carving out a sideways-to-slightly-higher base after the sharp Q4 selloff. The chart explicitly labels that “Base” region, with price repeatedly holding a low-to-mid $80,000s floor area before turning higher. That basing process matters in Bollinger’s framing because it provided the platform for volatility compression to do its work.
The squeeze is visible in the Bollinger BandWidth panel at the bottom of the chart, where BandWidth sinks to a marked low (“Squeeze”) and then begins to turn up. That inflection is paired with a sharp surge in the %B panel (the middle indicator pane), where %B drives up through the 1.0 line, an on-chart signal that price has pushed beyond the upper Bollinger Band.
Bollinger annotates that moment as the “Breakout,” and the price panel shows the market accelerating higher off the base as the bands begin to open. On Bollinger’s chart, BTC is trading at $94,484, with the upper band curling higher and the mid-band rising beneath price. In plain terms: the move is no longer just compression; it is active expansion.
Bollinger’s chart draws two horizontal red targets above current price: the first at $100,000 and the second near $107,000.
The risk control is equally clear in his commentary. “If we fail here it is back into the trenches,” he wrote, language that, in chart terms, points to BTC losing the breakout and slipping back into the prior base region which is capped at the $93,500 region . This price level is of utmost importance for Bollinger.
What About ETH And XRP?
Bollinger also addressed the broader crypto market:“Someone asked about ETHUSD. Same pattern, a bit delayed, following not leading,” he wrote, positioning ether as a lagging participant rather than the driver.
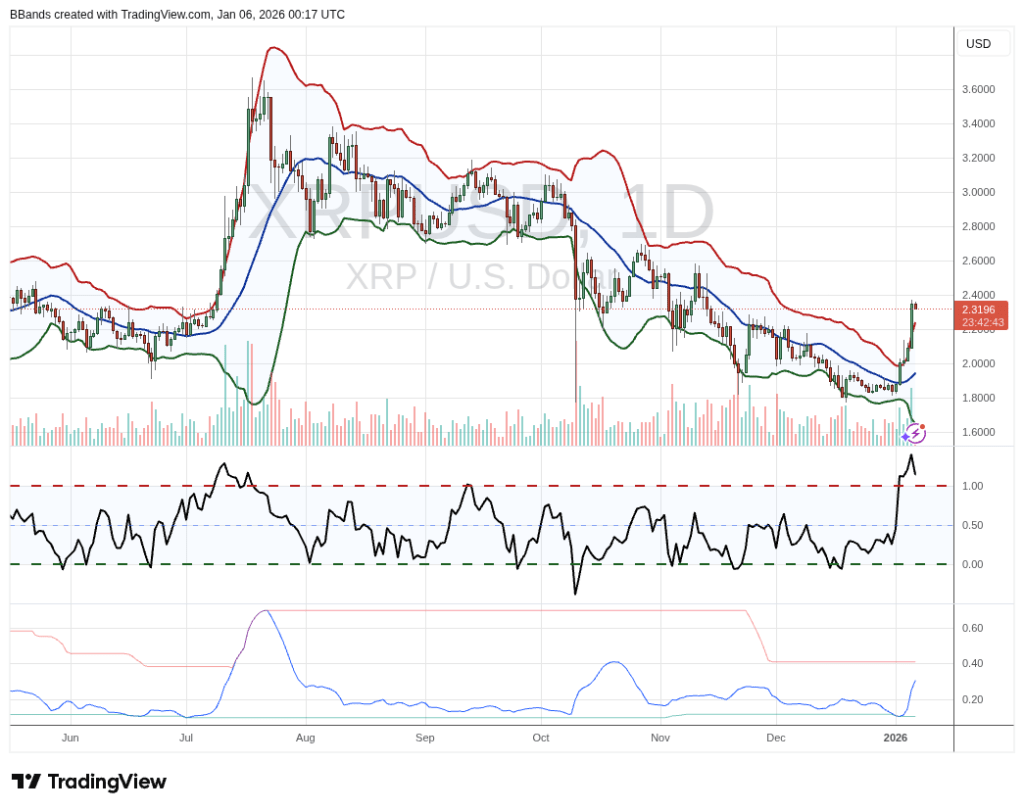
For XRP , Bollinger’s take was more cautious despite the obvious lift. “And ripple, strong lift, but the pattern is weaker. BTC > ETH > XRP for now.”
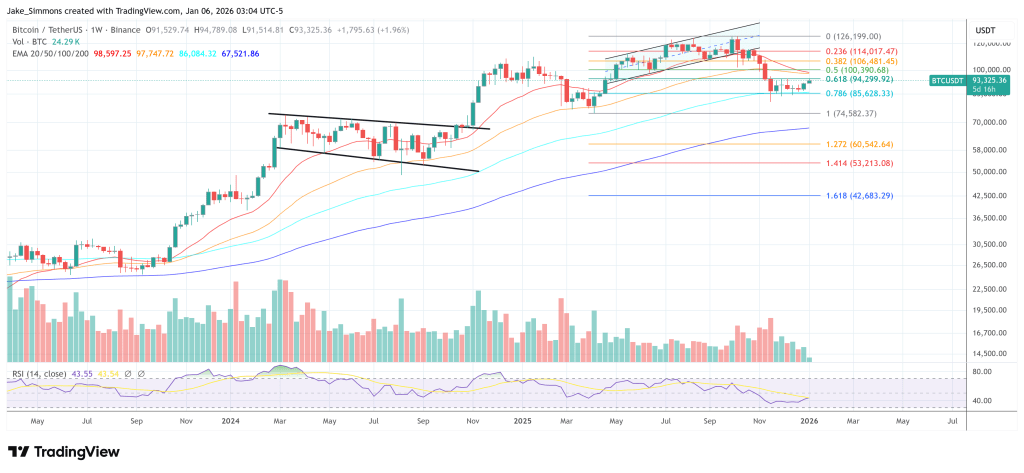
At press time, BTC traded at $93,325.


.jpg)