Dogecoin (DOGE) Resilient Above $0.20 – Can Momentum Shift Toward Fresh Upside?


Dogecoin started a fresh increase above the $0.20 zone against the US Dollar. DOGE is now consolidating and might aim for more gains if it clears $0.2180.
- DOGE price started a fresh upward move above $0.20 and $0.2050.
- The price is trading above the $0.20 level and the 100-hourly simple moving average.
- There is a bullish trend line forming with support at $0.1980 on the hourly chart of the DOGE/USD pair (data source from Kraken).
- The price could aim for more gains if it remains stable above $0.1880.
Dogecoin Price Eyes Fresh Upside
Dogecoin price started a fresh increase after it settled above $0.1880, like Bitcoin and Ethereum . DOGE climbed above the $0.20 resistance to enter a positive zone.
The bulls were able to push the price above $0.2050 and $0.2120. A high was formed at $0.2182 and the price is now correcting gains. There was a move below the 50% Fib retracement level of the recent wave from the $0.1787 swing low to the $0.2182 high.
Dogecoin price is now trading above the $0.20 level and the 100-hourly simple moving average. Besides, there is a bullish trend line forming with support at $0.1980 on the hourly chart of the DOGE/USD pair.
If there is another increase, immediate resistance on the upside is near the $0.2085 level. The first major resistance for the bulls could be near the $0.2120 level. The next major resistance is near the $0.2180 level. A close above the $0.2180 resistance might send the price toward $0.2320. Any more gains might send the price toward $0.250. The next major stop for the bulls might be $0.2620.
Another Decline In DOGE?
If DOGE’s price fails to climb above the $0.2120 level, it could start a downside correction. Initial support on the downside is near the $0.20 level. The next major support is near the $0.1980 level and the trend line.
The main support sits at $0.1880. If there is a downside break below the $0.1880 support, the price could decline further. In the stated case, the price might slide toward the $0.1720 level or even $0.1650 in the near term.
Technical Indicators
Hourly MACD – The MACD for DOGE/USD is now losing momentum in the bullish zone.
Hourly RSI (Relative Strength Index) – The RSI for DOGE/USD is now below the 50 level.
Major Support Levels – $0.1980 and $0.1880.
Major Resistance Levels – $0.2120 and $0.2180.
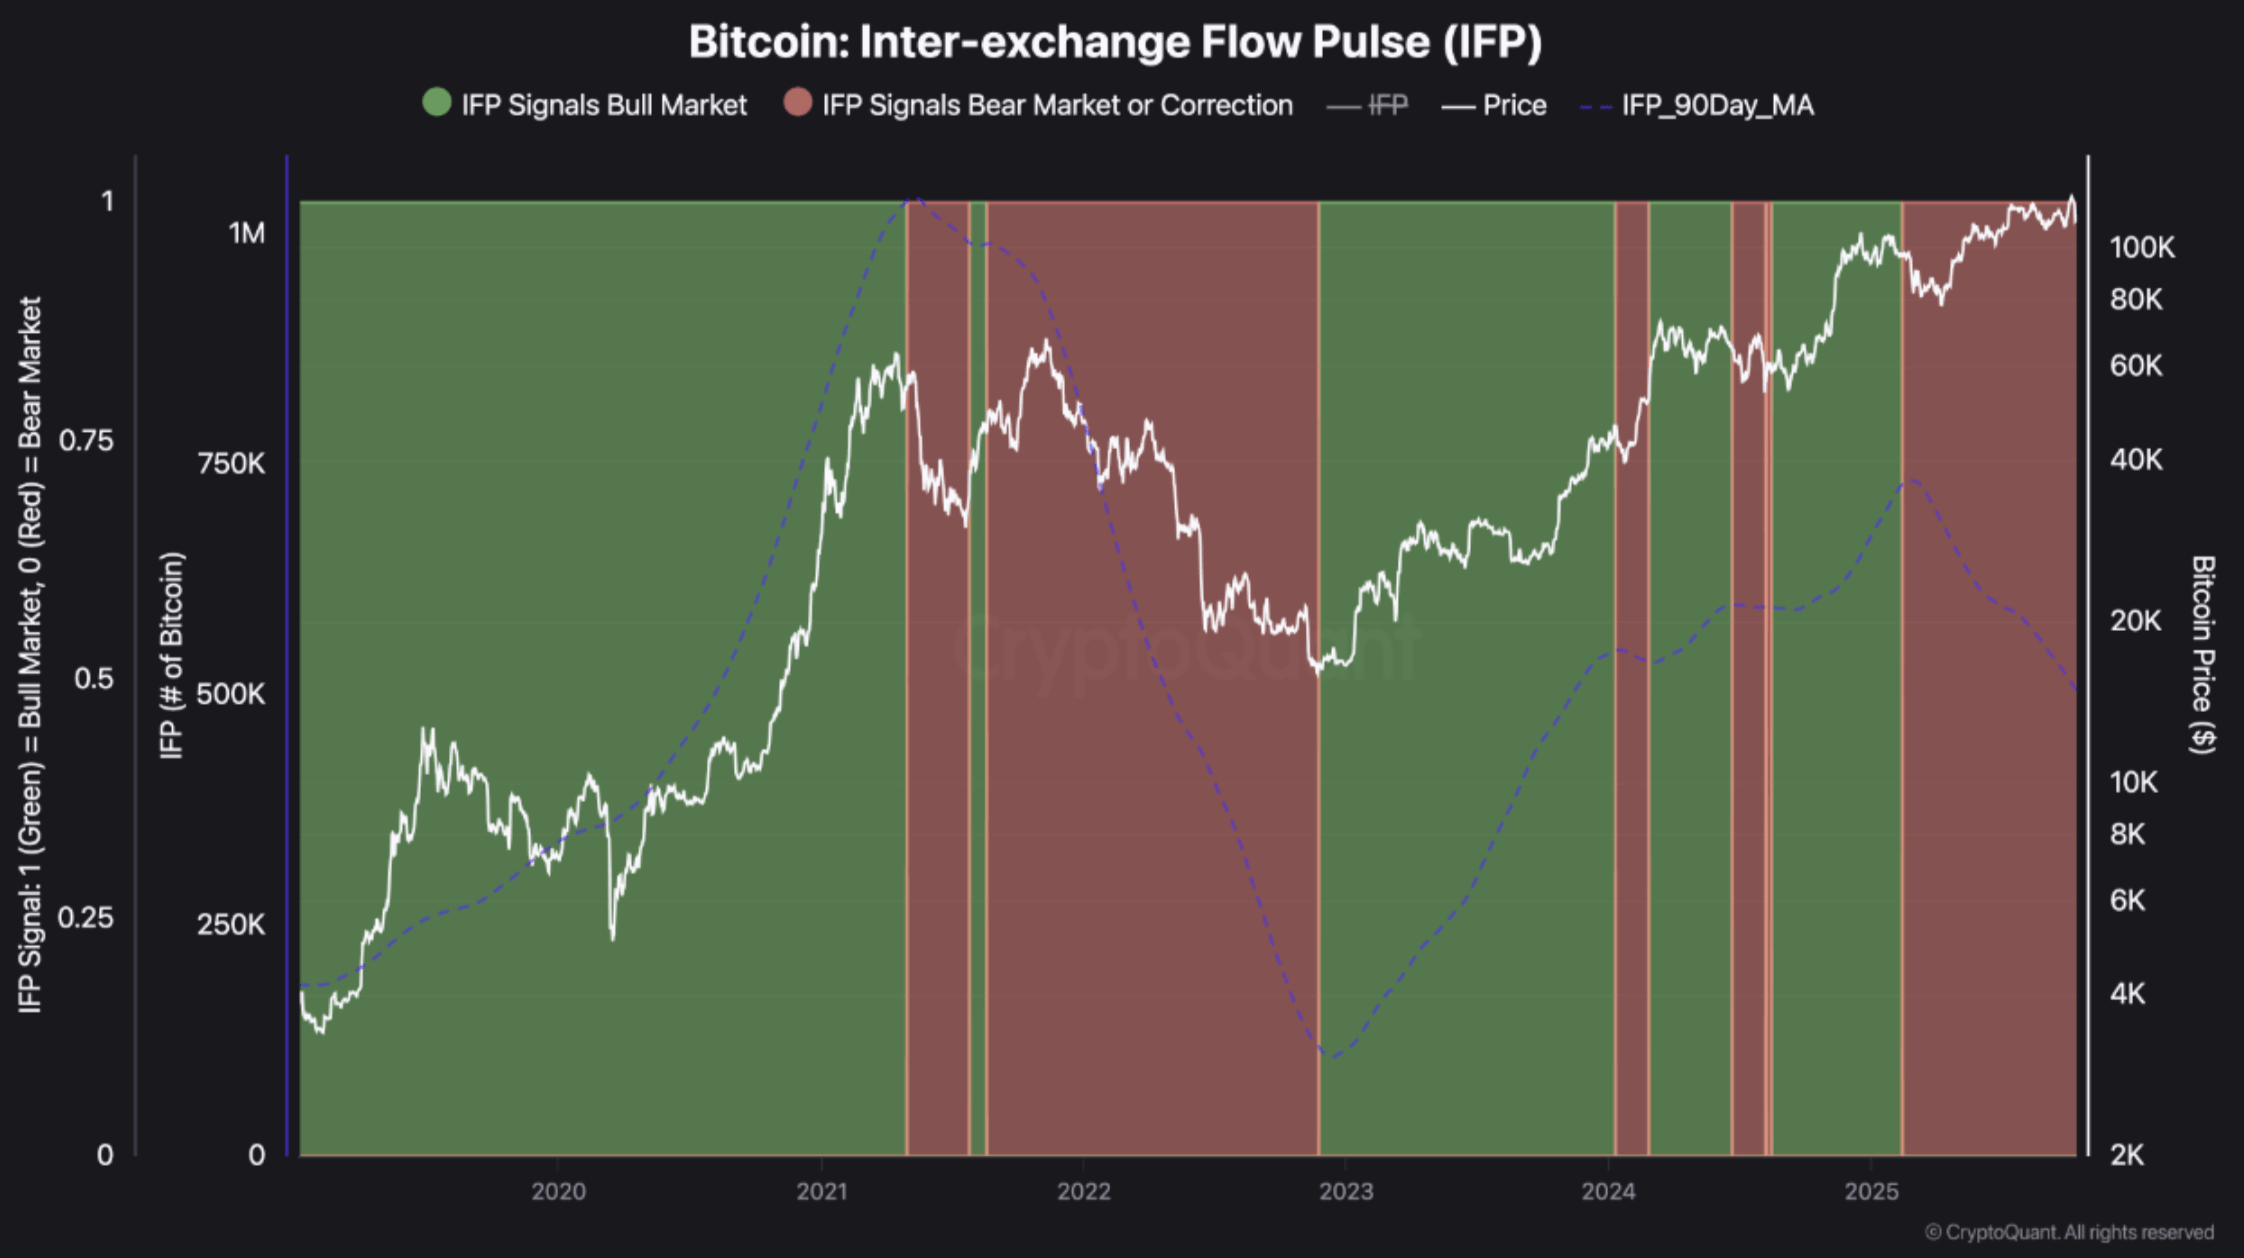
Bitcoin Market Feels “Too Efficient” As Arbitrage Opportunities Vanish – What It Means For Price?
As Bitcoin (BTC) tries to recover from its weekend sell-off that saw it almost crash to $100,000, so...

What’s Driving The Drop? Bitcoin, Ethereum, And XRP Struggle Amid Market Uncertainty
After beginning the week above the critical $115,000 mark, Bitcoin (BTC) and the broader cryptocurre...
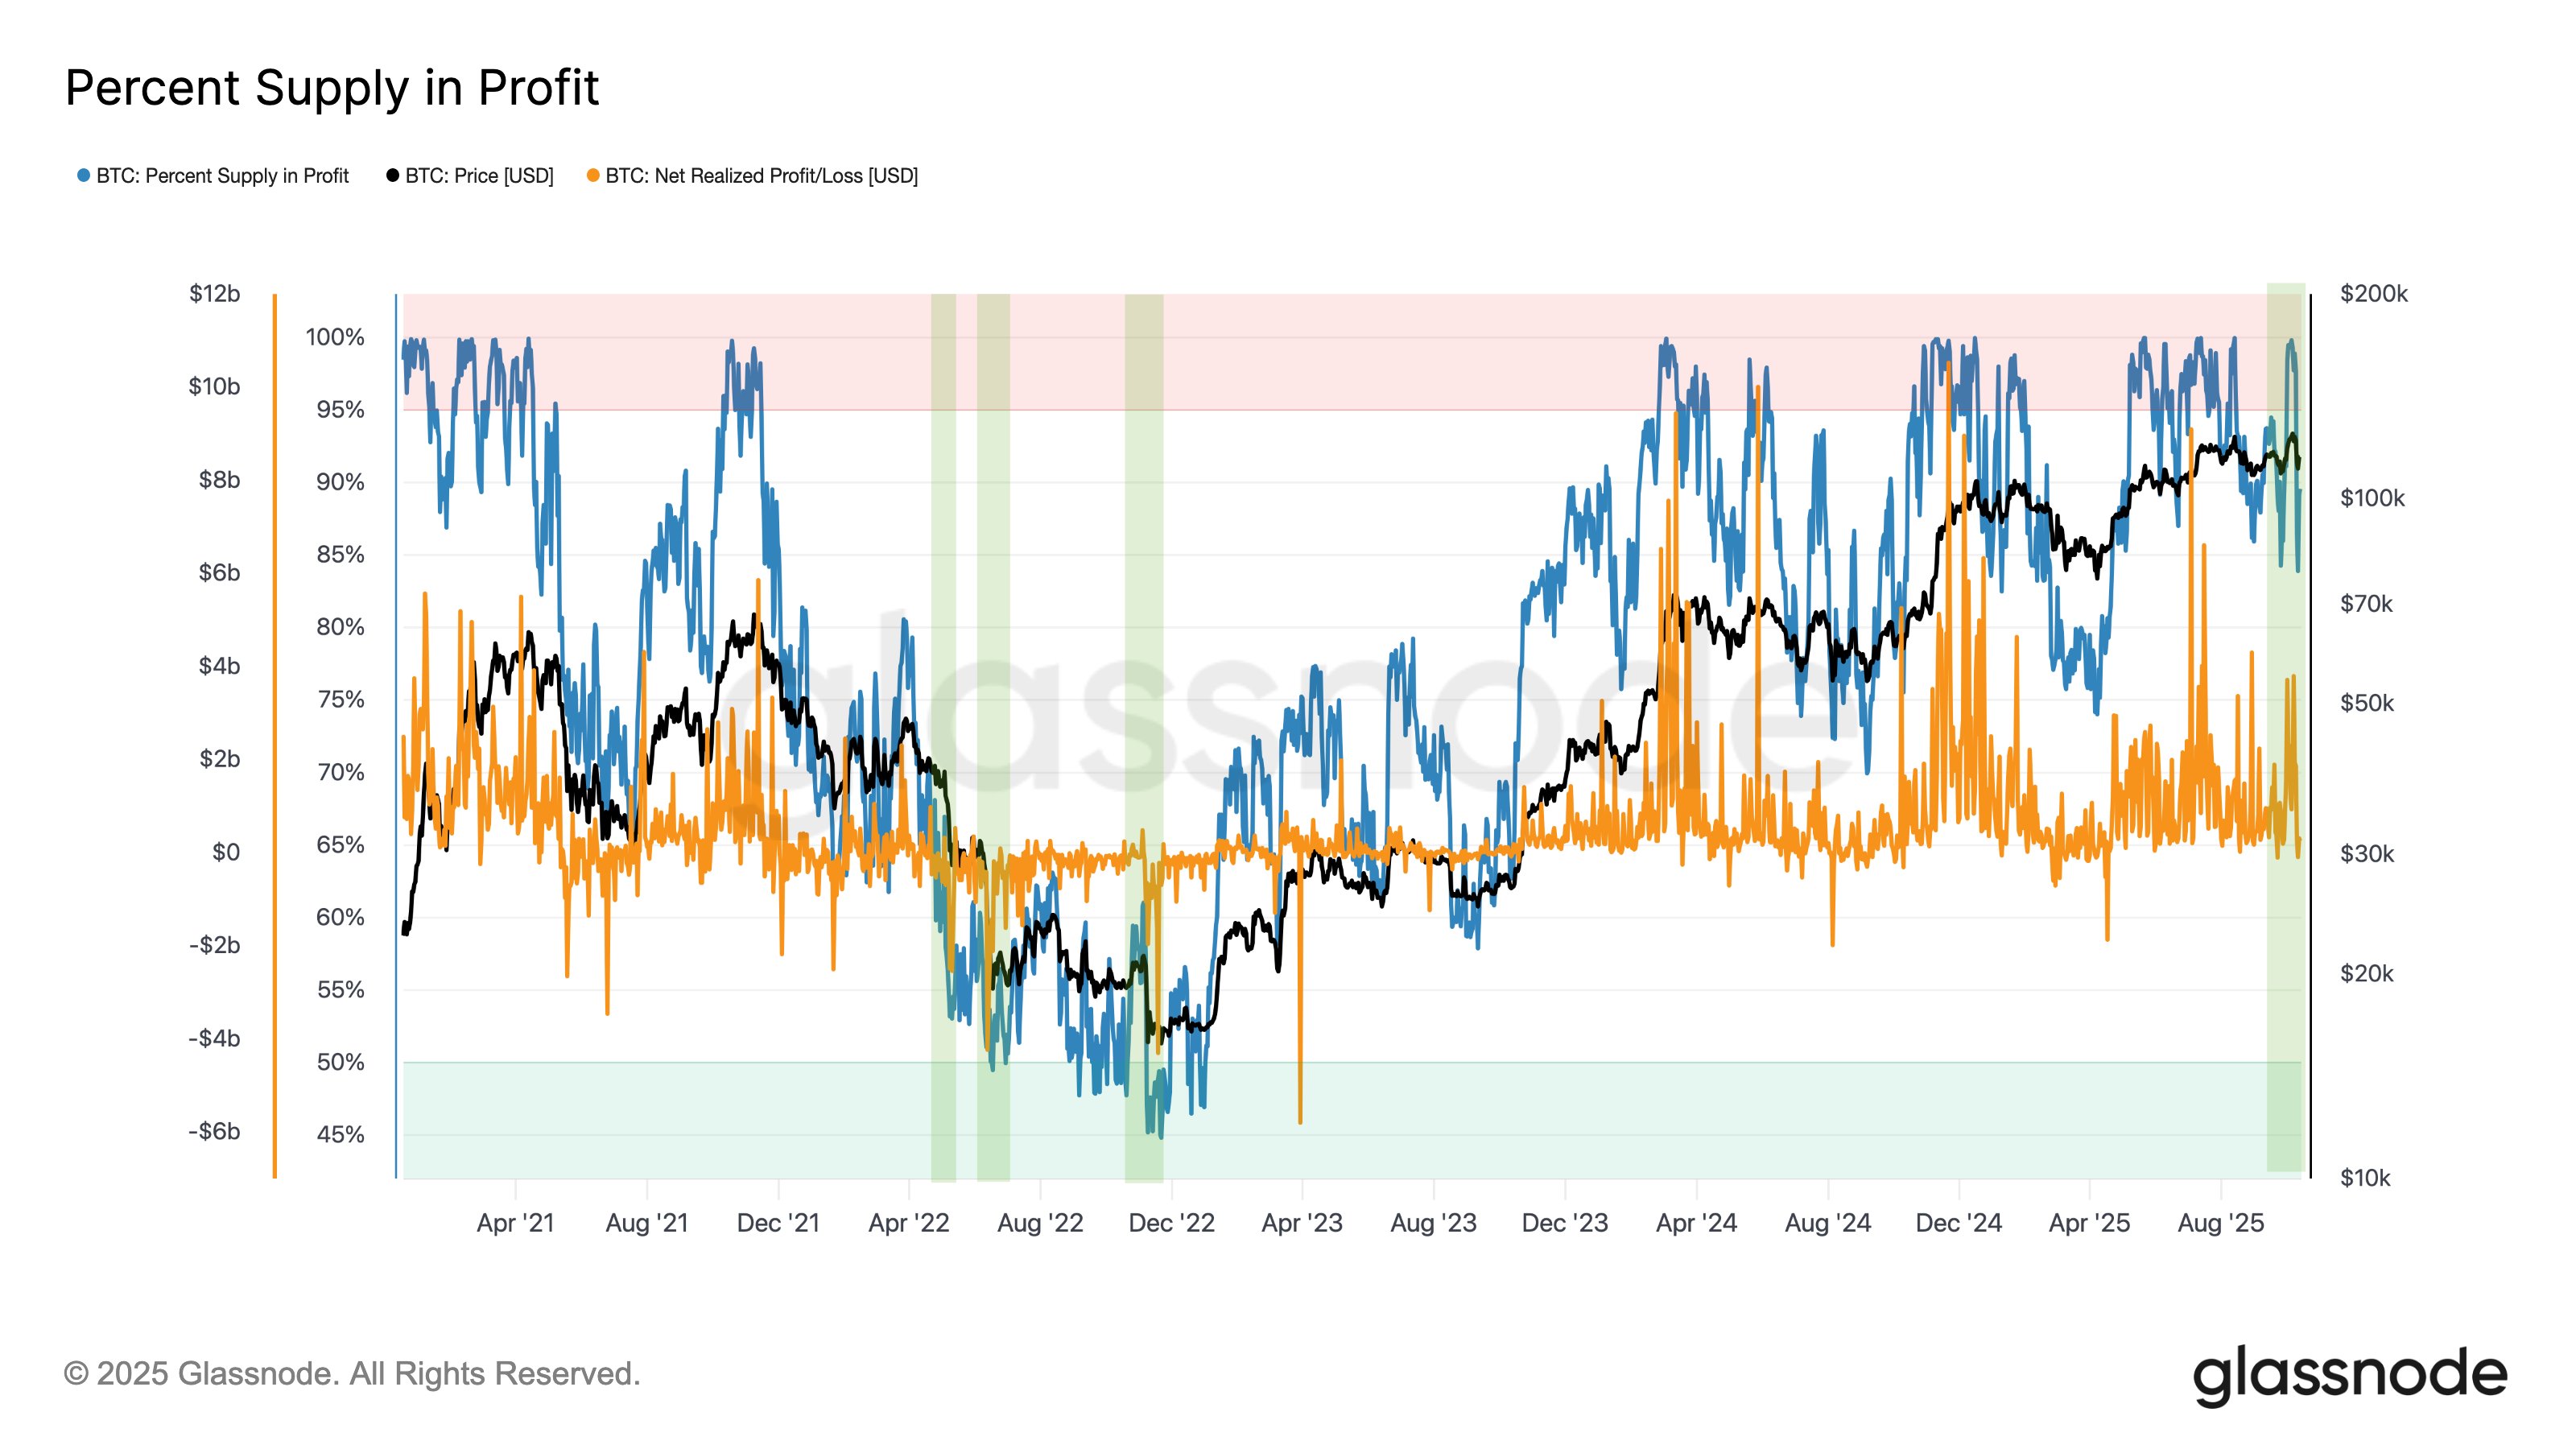
Bitcoin Crash Unlike LUNA & FTX Collapses, Says Glassnode: Here’s Why
On-chain analytics firm Glassnode has explained how the latest Bitcoin selloff is different from the...