Dogecoin (DOGE) Bears Eye Breakdown Below $0.20 After Steep Correction


Dogecoin started a fresh decline below the $0.220 zone against the US Dollar. DOGE is now consolidating and might dip further below $0.2050.
- DOGE price started a fresh decline below the $0.220 level.
- The price is trading below the $0.2150 level and the 100-hourly simple moving average.
- There is a bearish trend line forming with resistance at $0.2160 on the hourly chart of the DOGE/USD pair (data source from Kraken).
- The price could start a fresh upward move if it stays above the $0.20 zone.
Dogecoin Price Dips Again
Dogecoin price started a fresh decline after there was a close below $0.2320, like Bitcoin and Ethereum . DOGE declined below the $0.220 and $0.2150 support levels.
The price even traded below $0.210. A low was formed at $0.2059 and the price is now consolidating losses. There was a minor recovery wave but the price is still below the 23.6% Fib retracement level of the recent decline from the $0.2672 swing high to the $0.2059 low.
Dogecoin price is now trading below the $0.2150 level and the 100-hourly simple moving average. If there is a recovery wave, immediate resistance on the upside is near the $0.2160 level. There is also a bearish trend line forming with resistance at $0.2160 on the hourly chart of the DOGE/USD pair.
The first major resistance for the bulls could be near the $0.2280 level. The next major resistance is near the $0.2365 level. It is close to the 50% Fib retracement level of the recent decline from the $0.2672 swing high to the $0.2059 low.
A close above the $0.2365 resistance might send the price toward the $0.2450 resistance. Any more gains might send the price toward the $0.250 level. The next major stop for the bulls might be $0.2550.
Another Decline In DOGE?
If DOGE’s price fails to climb above the $0.2160 level, it could continue to move down. Initial support on the downside is near the $0.2060 level. The next major support is near the $0.2020 level.
The main support sits at $0.20. If there is a downside break below the $0.20 support, the price could decline further. In the stated case, the price might slide toward the $0.1880 level or even $0.1820 in the near term.
Technical Indicators
Hourly MACD – The MACD for DOGE/USD is now gaining momentum in the bearish zone.
Hourly RSI (Relative Strength Index) – The RSI for DOGE/USD is now below the 50 level.
Major Support Levels – $0.2000 and $0.1880.
Major Resistance Levels – $0.2160 and $0.2280.

Chainlink Ready For Massive Breakout? A 15% Drop May Come First
Chainlink (LINK) is retesting a crucial support zone amid the market pullback, leading some analysts...
Tether Stays On Top, But These Three Competitors Are Closing In On USDT
The recent passage of the GENIUS Act introduced a new regulatory framework for stablecoins, such as ...
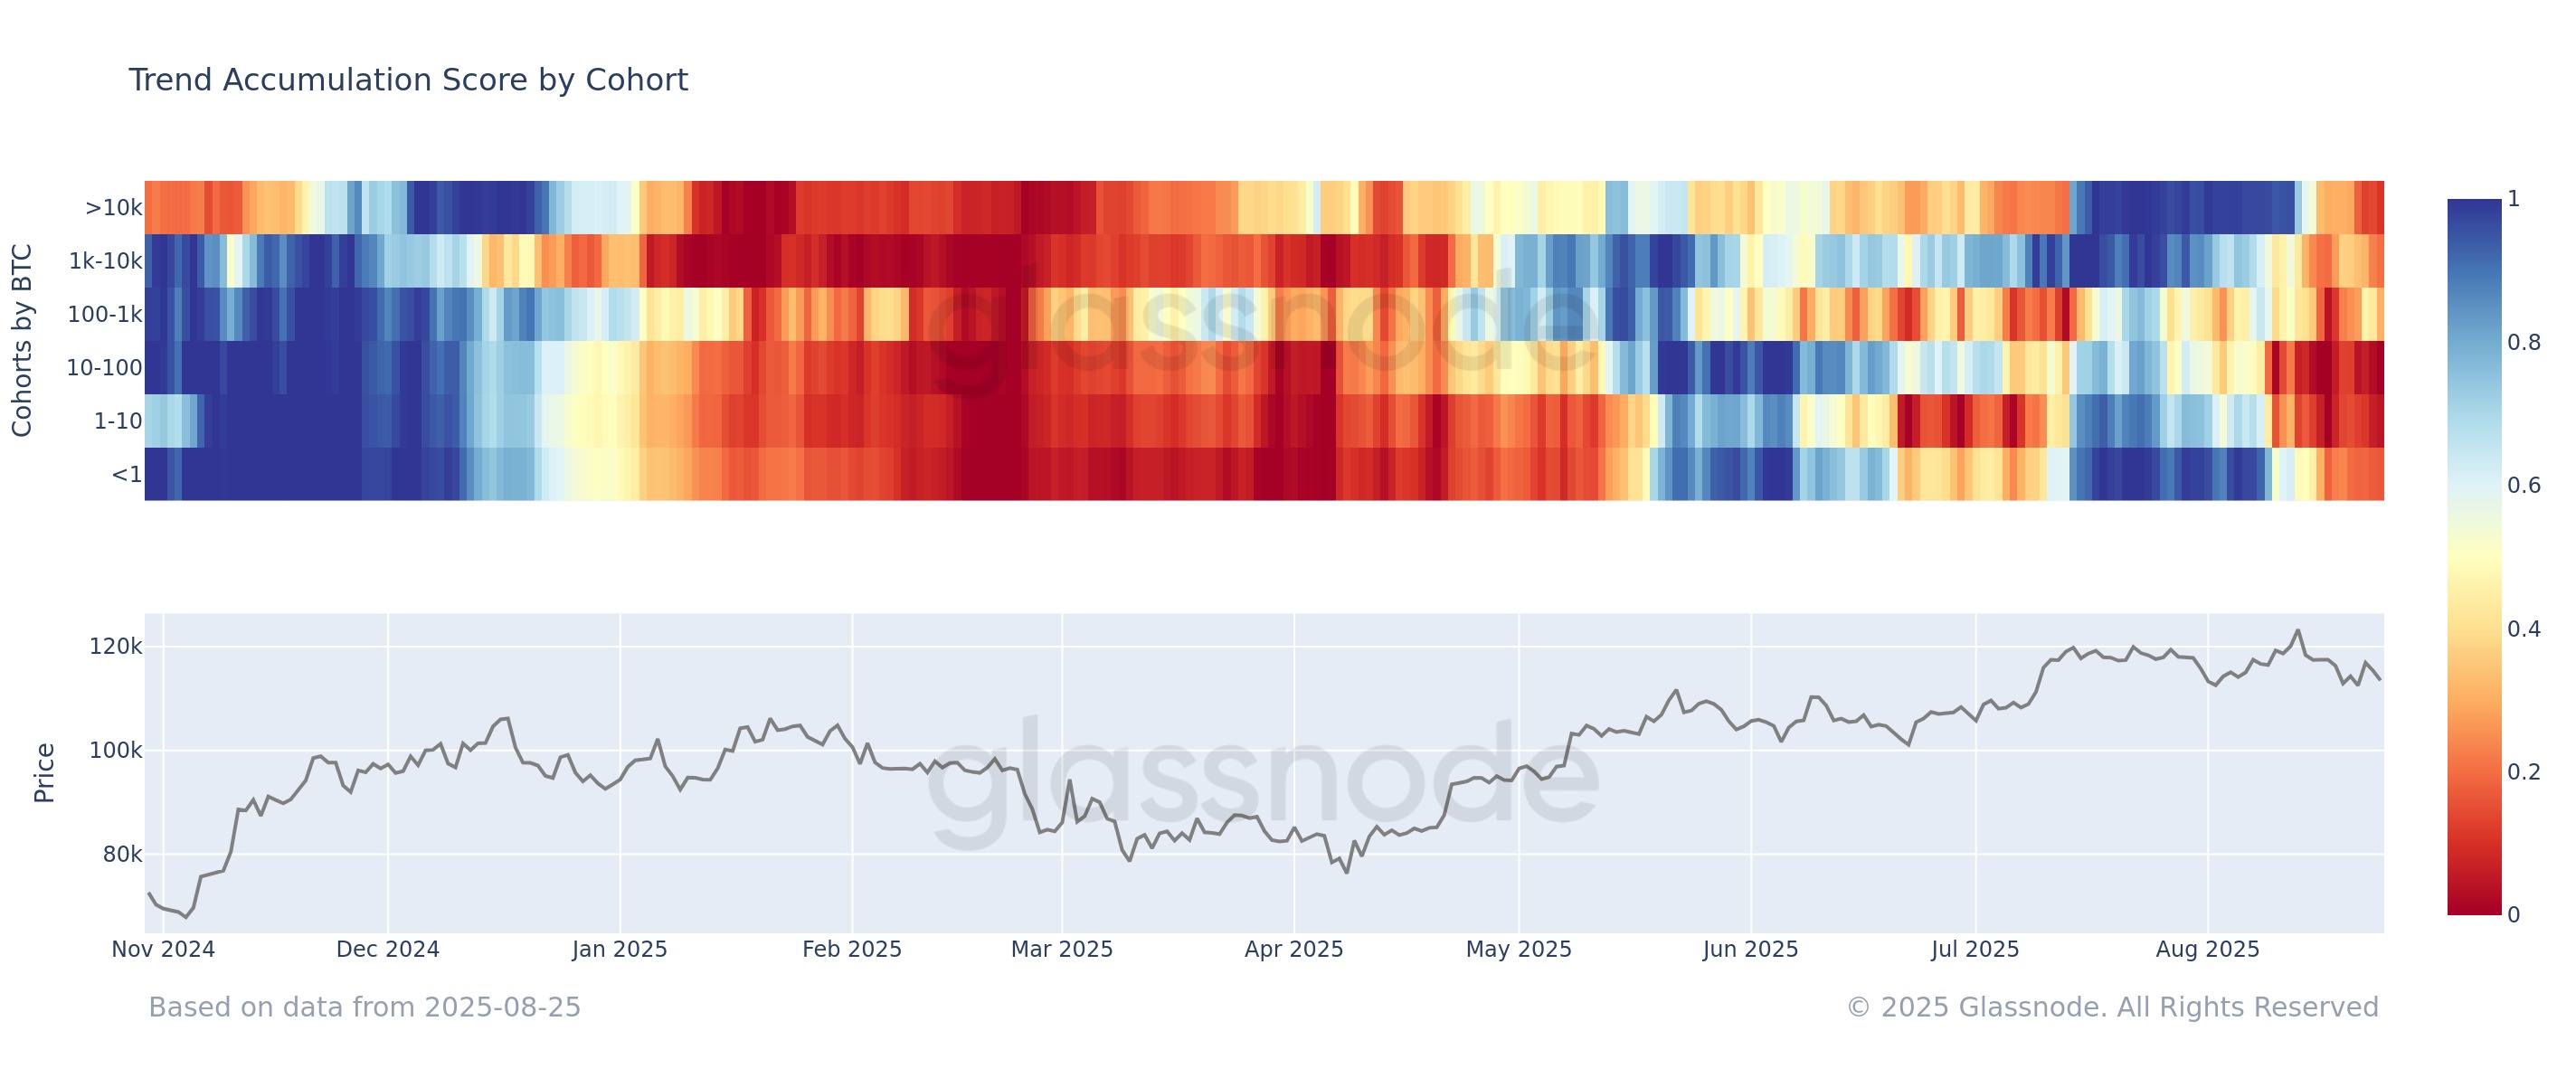
Bitcoin Dives As On-Chain Data Shows Every Cohort Now Selling
On-chain data shows all Bitcoin investor cohorts have pivoted to distribution recently, an indicatio...