Cardano (ADA) Sideways — Support Intact, But No Spark for a Move Yet


Cardano price started a fresh decline from the $0.590 zone. ADA is now consolidating and might attempt a fresh increase above the $0.5820 zone.
- ADA price started a fresh decline below $0.5820 and $0.5750.
- The price is trading above $0.560 and the 100-hourly simple moving average.
- There is a key bullish trend line forming with support at $0.5640 on the hourly chart of the ADA/USD pair (data source from Kraken).
- The pair could start a fresh decline if it dips below the $0.5560 support zone.
Cardano Price Fails To Extend Gains
In the past few sessions, Cardano saw a fresh decline from the $0.590 zone, unlike Bitcoin and Ethereum . ADA declined below the $0.580 level and trimmed most gains.
The bears pushed the price below the 50% Fib retracement level of the upward move from the $0.5567 swing low to the $0.5902 high. The price even spiked below the $0.570 support but stayed above $0.5650. There is also a key bullish trend line forming with support at $0.5640 on the hourly chart of the ADA/USD pair.
The trend line is close to the 76.4% Fib retracement level of the upward move from the $0.5567 swing low to the $0.5902 high. Cardano price is now trading above $0.5650 and the 100-hourly simple moving average.
On the upside, the price might face resistance near the $0.5735 zone. The first resistance is near $0.5820. The next key resistance might be $0.590. If there is a close above the $0.590 resistance, the price could start a strong rally. In the stated case, the price could rise toward the $0.620 region. Any more gains might call for a move toward $0.6350 in the near term.
More Losses In ADA?
If Cardano’s price fails to climb above the $0.5820 resistance level, it could start another decline. Immediate support on the downside is near the $0.5640 level and the trend line.
The next major support is near the $0.5460 level. A downside break below the $0.5460 level could open the doors for a test of $0.5250. The next major support is near the $0.510 level where the bulls might emerge.
Technical Indicators
Hourly MACD – The MACD for ADA/USD is gaining momentum in the bearish zone.
Hourly RSI (Relative Strength Index) – The RSI for ADA/USD is now below the 50 level.
Major Support Levels – $0.5640 and $0.5460.
Major Resistance Levels – $0.5735 and $0.5820.
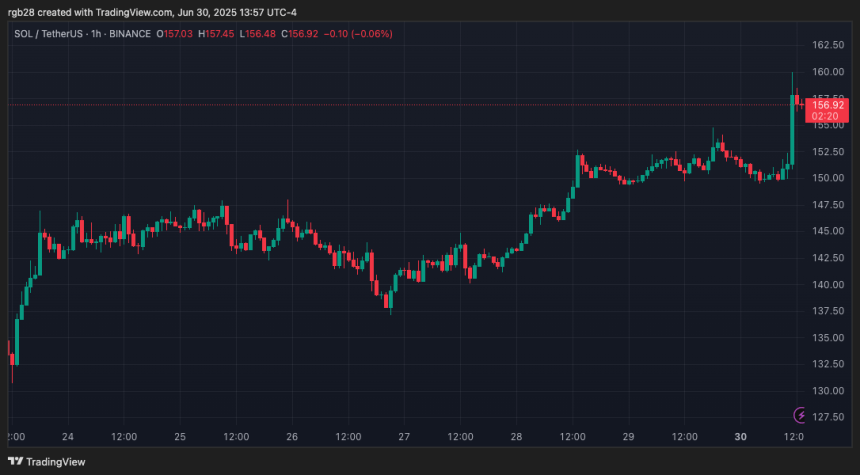
Solana Summer Loading? SOL Eyes $180 Following Staked ETF-Fueled Breakout
Solana (SOL) has retested a crucial resistance level after recovering the $150 level over the weeken...
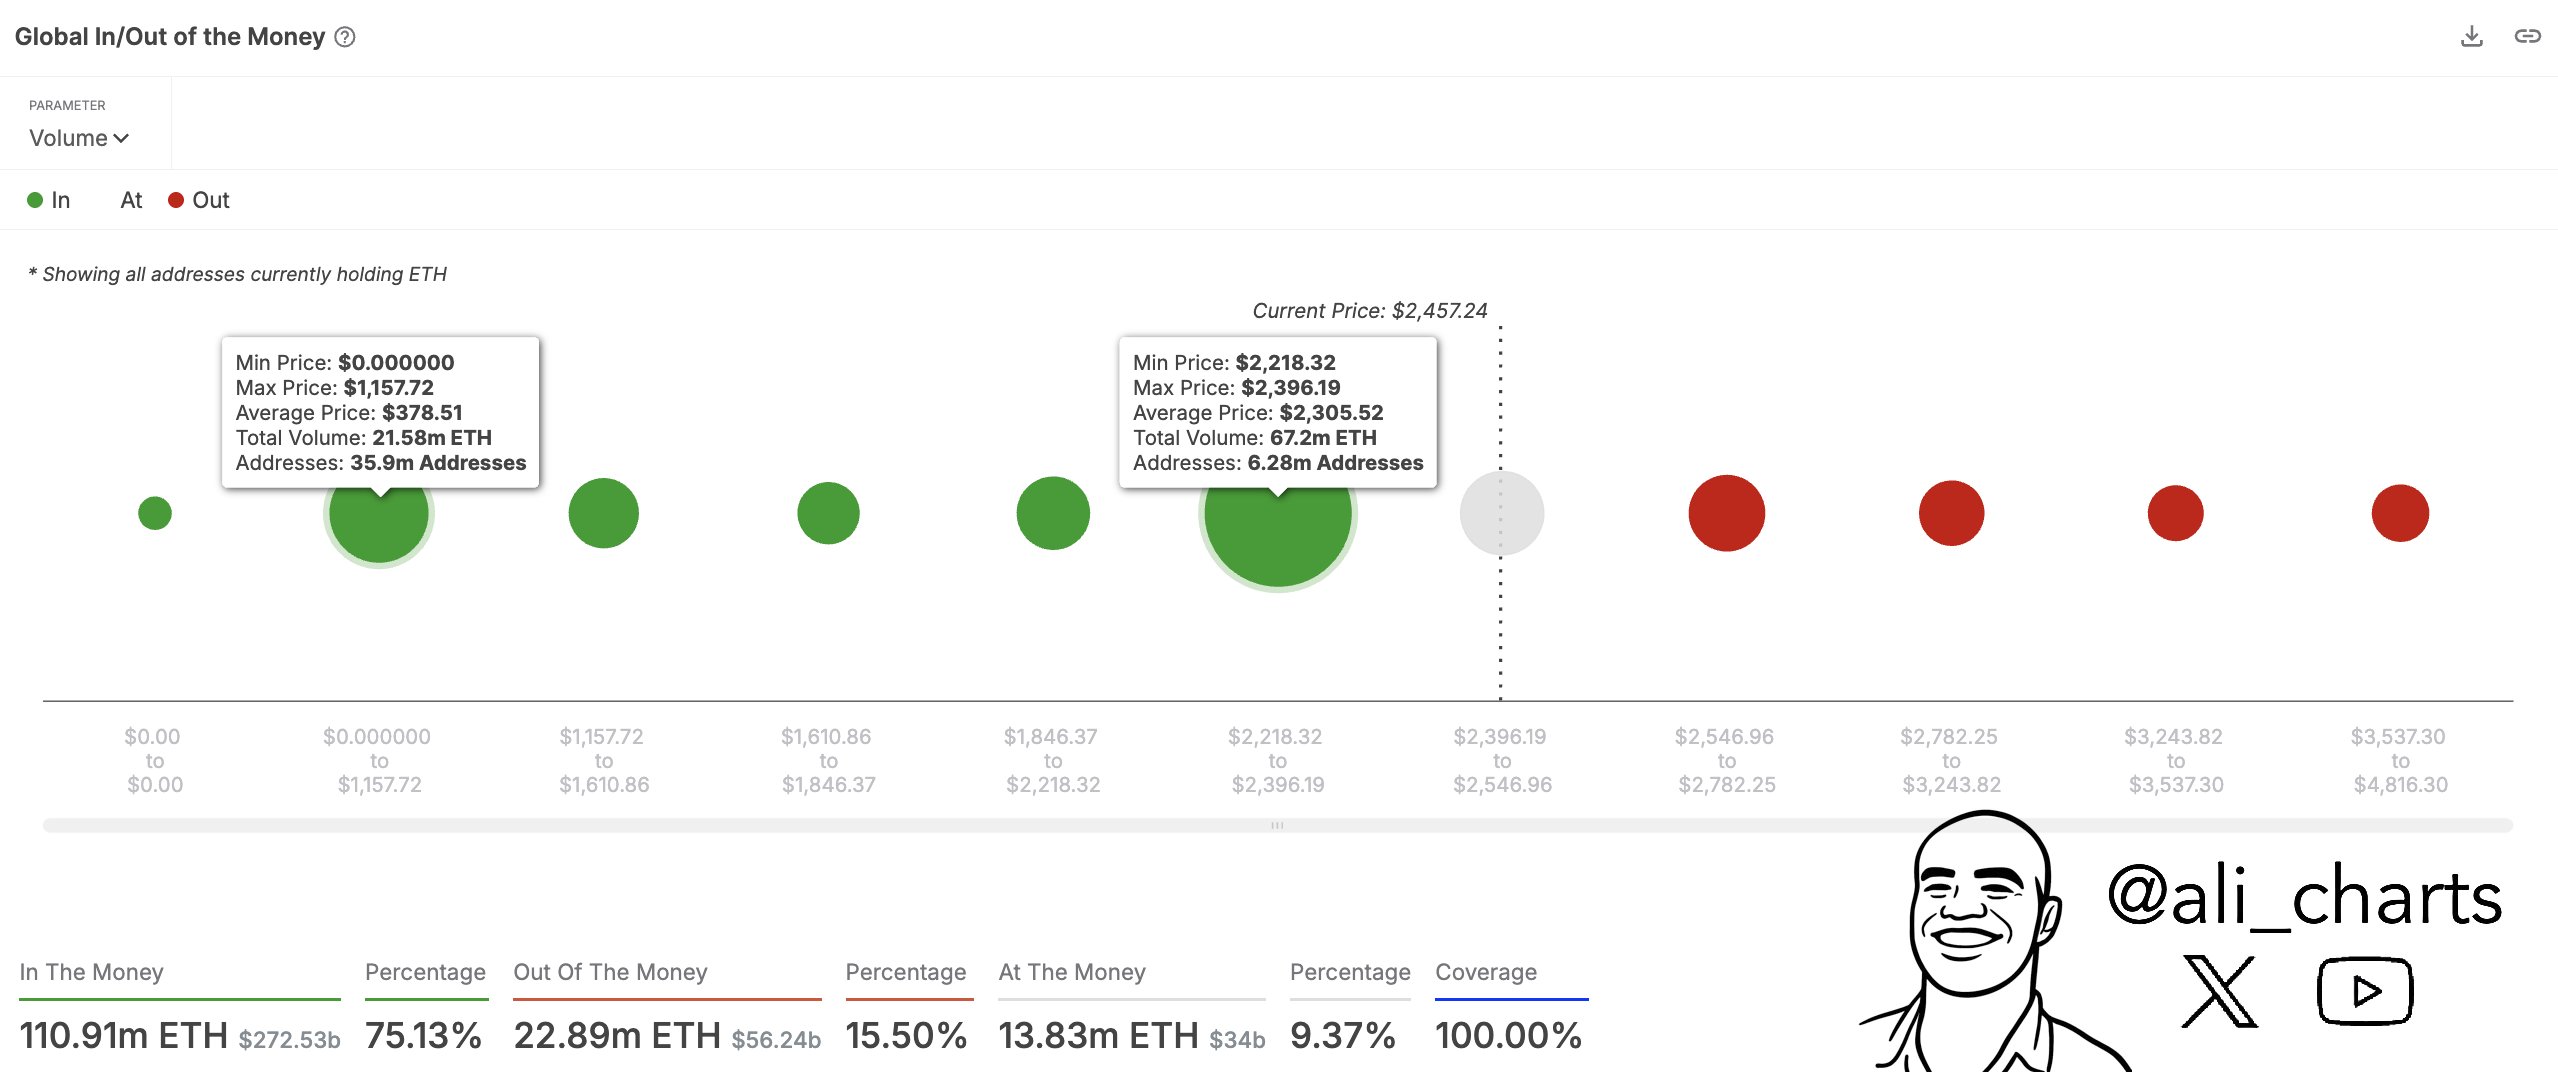
Ethereum At Risk? If $2,200 Cracks, $1,160 May Be Coming
Ethereum currently has strong support at $2,200, but one analyst has pointed out that if the level f...
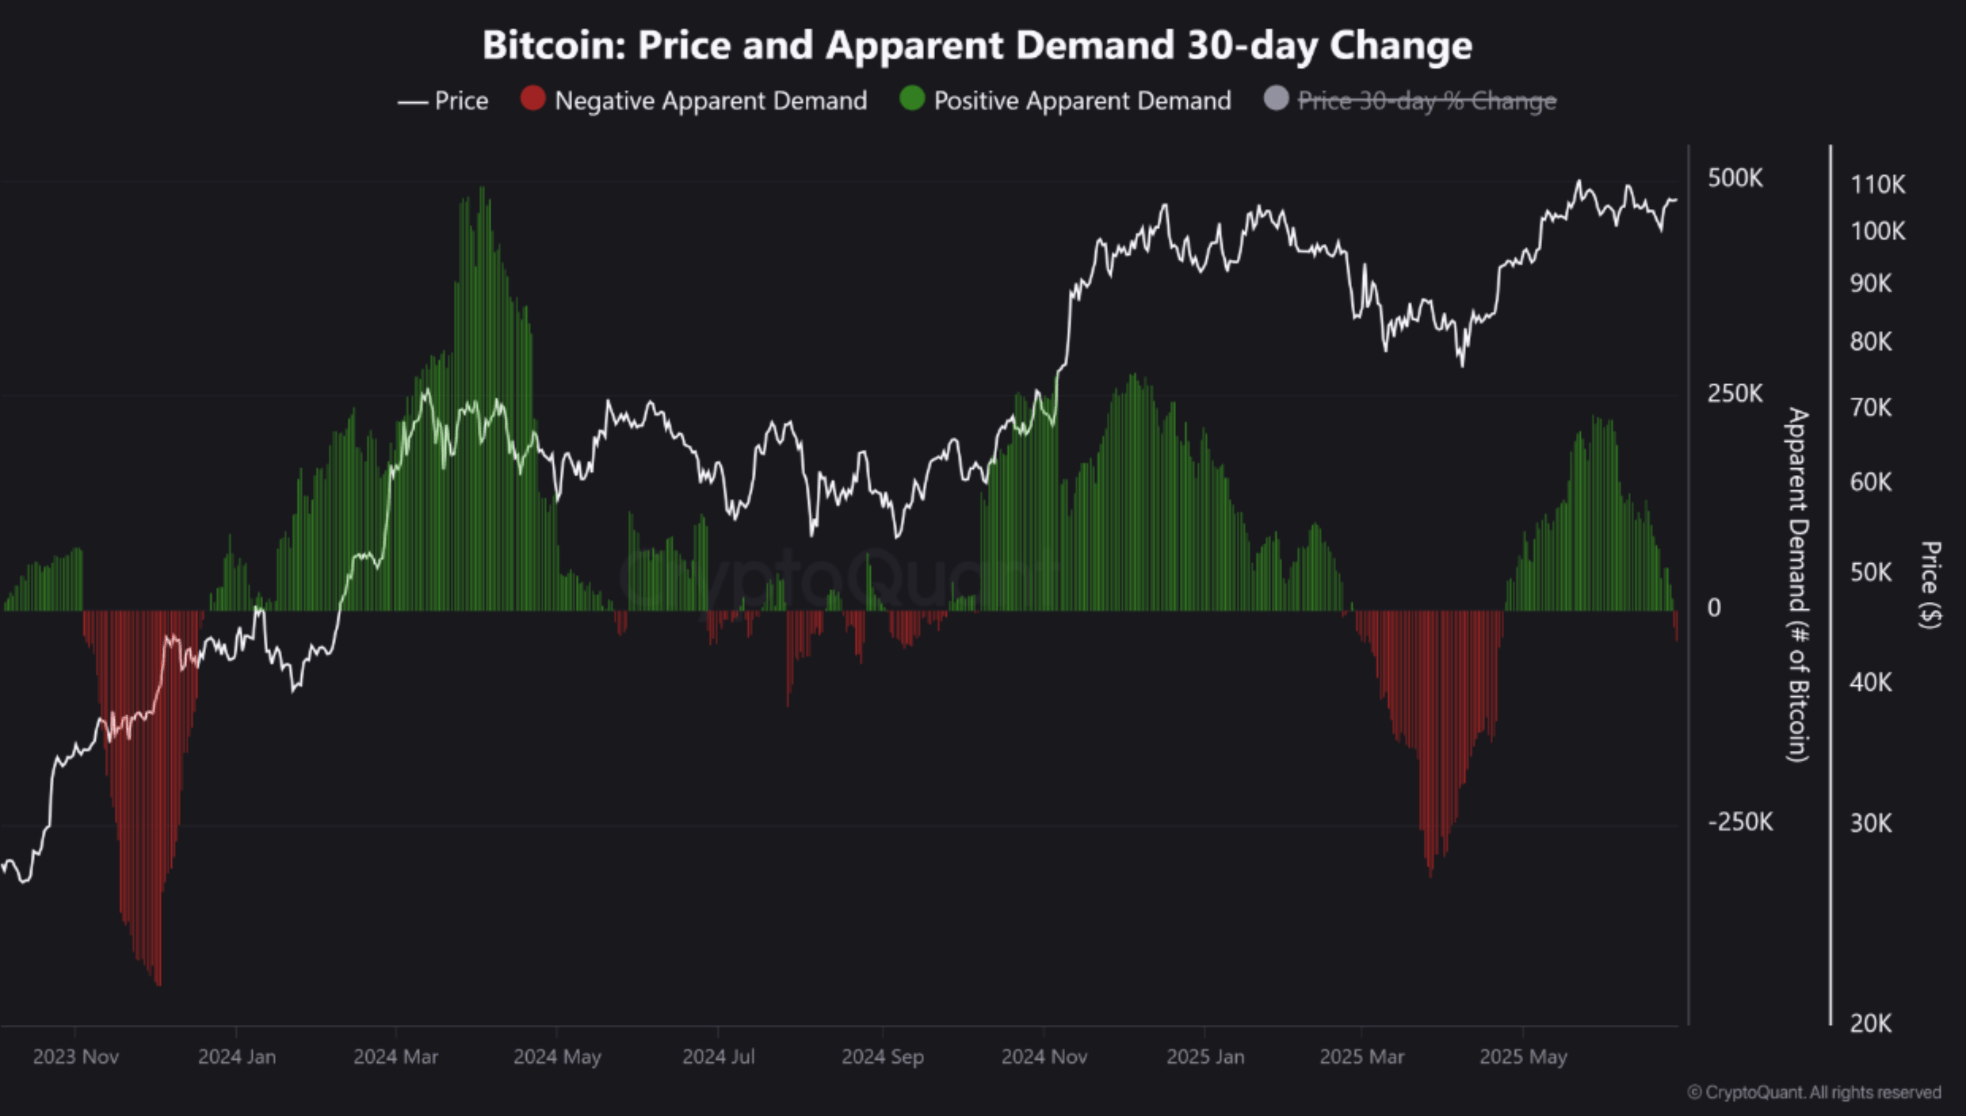
Bitcoin Market Enters Caution Zone Amid Rising Sell-Side Pressure, Analyst Says
Although Bitcoin (BTC) has recorded slight gains over the past month – up 3.6% in the last 30 days –...