Bitcoin Price Extends Losses — Is More Downside on the Horizon?


Bitcoin price started a fresh decline and tested the $104,600 zone. BTC is now consolidating and might struggle to recover above $107,500.
- Bitcoin started a fresh decline below the $107,500 zone.
- The price is trading below $107,000 and the 100 hourly Simple moving average.
- There is a connecting bearish trend line forming with resistance at $107,550 on the hourly chart of the BTC/USD pair (data feed from Kraken).
- The pair could extend losses if it breaks the $104,000 support zone.
Bitcoin Price Dips Further
Bitcoin price started a fresh decline and traded below the $107,500 support zone . BTC even traded below the $105,600 level and tested the next support at $104,600.
A low was formed at $104,604 and the price is now consolidating losses. There was a move above the $105,200 level, but the price is still below the 23.6% Fib retracement level of the recent decline from the $110,500 swing high to the $104,604 low.
Bitcoin is now trading below $107,000 and the 100 hourly Simple moving average . On the upside, immediate resistance is near the $106,000 level.
The first key resistance is near the $107,000 level. The next key resistance could be $107,500. There is also a connecting bearish trend line forming with resistance at $107,550 on the hourly chart of the BTC/USD pair. It is close to the 50% Fib retracement level of the recent decline from the $110,500 swing high to the $104,604 low.
A close above the $107,500 resistance might send the price further higher. In the stated case, the price could rise and test the $108,000 resistance level. Any more gains might send the price toward the $110,000 level.
Another Drop In BTC?
If Bitcoin fails to rise above the $107,500 resistance zone, it could start another decline. Immediate support is near the $104,500 level. The first major support is near the $104,000 level.
The next support is now near the $103,200 zone. Any more losses might send the price toward the $102,500 support in the near term. The main support sits at $101,200, below which BTC might gain bearish momentum.
Technical indicators:
Hourly MACD – The MACD is now gaining pace in the bearish zone.
Hourly RSI (Relative Strength Index) – The RSI for BTC/USD is now below the 50 level.
Major Support Levels – $104,000, followed by $103,200.
Major Resistance Levels – $106,000 and $107,000.

Panama Canal Could Prioritize Bitcoin-Paying Ships, Mayor Suggests
Panama City’s mayor, Mayer Mizrachi, put forward an unusual plan at the Bitcoin 2025 conference in L...
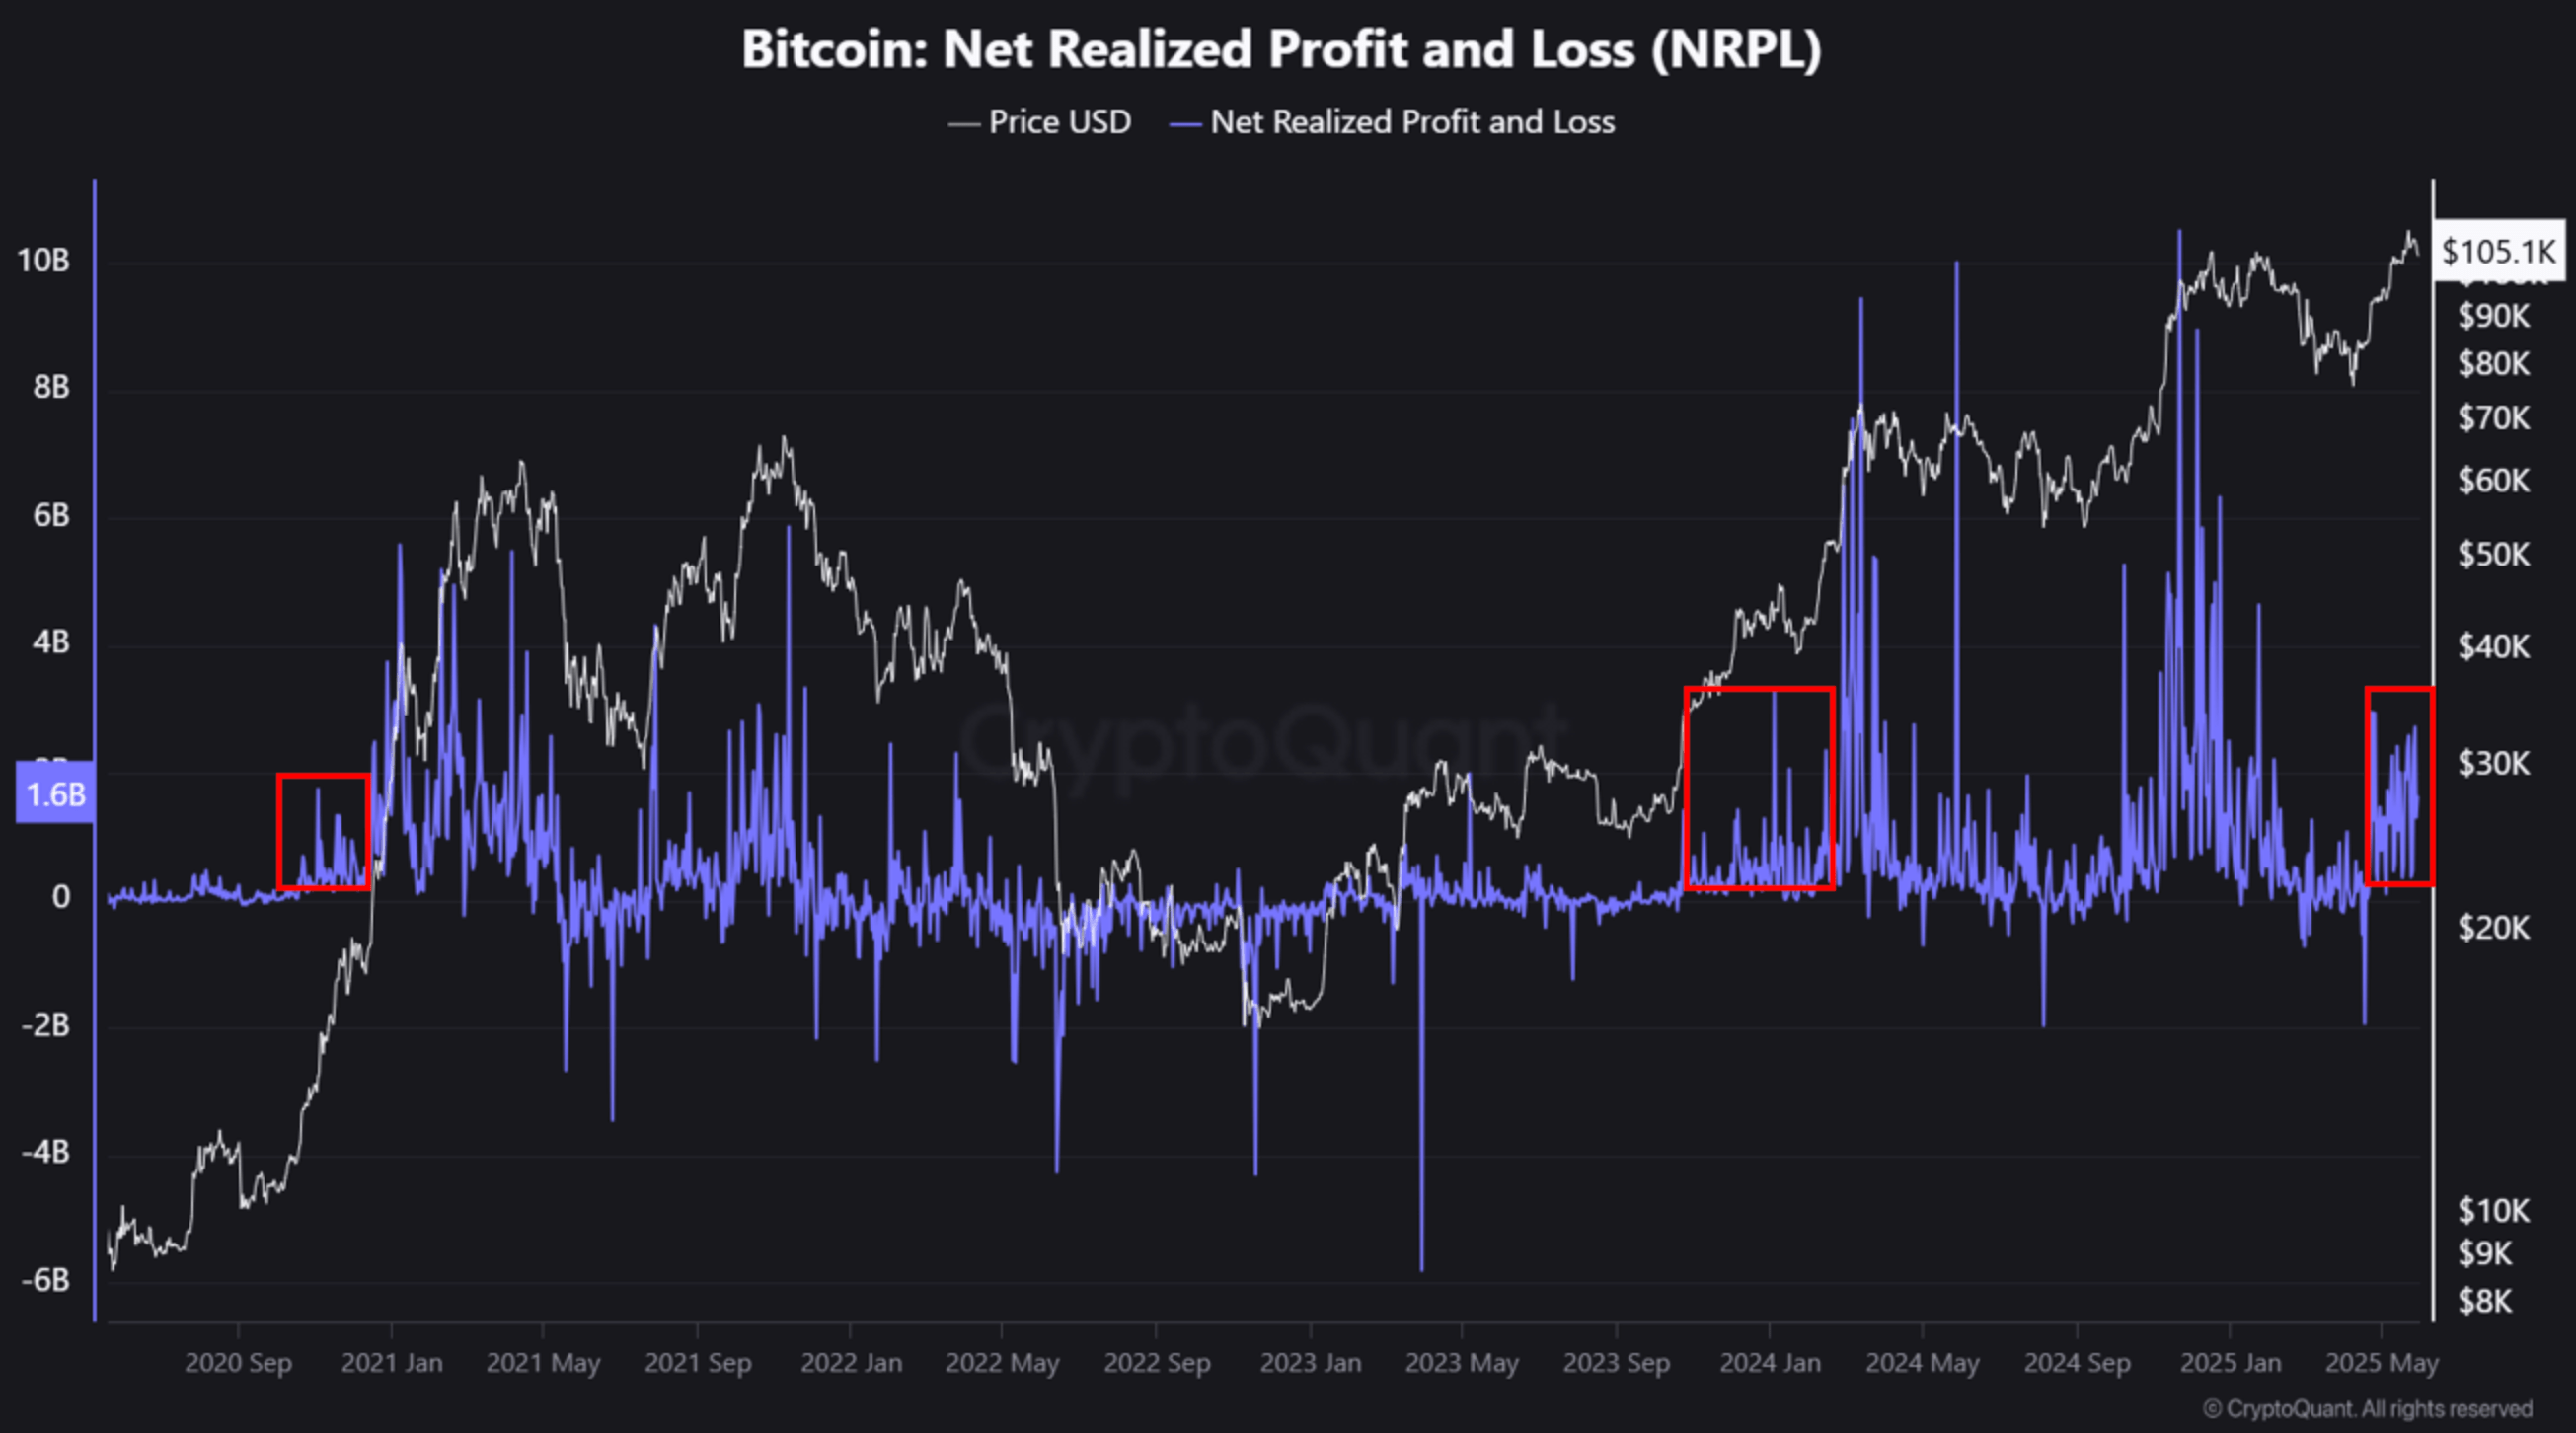
Bitcoin Upward Momentum ‘Highly Likely’ To Continue, On-Chain Data Shows
Although Bitcoin (BTC) appears to have stalled in the mid-$100,000 range, on-chain data indicates th...

Halfway To Clean: Bitcoin Hits 50% Renewable Mark, Ripple Chairman Reacts
Ripple’s chairman Chris Larsen praised the crypto network’s move toward greener energy this week. He...