



The Bitcoin downturn is not related to the cryptocurrency market.
The underlying strategy that helped it in the third quarter is now working against it, and the market is re-evaluating all the leveraged positions that thought $80,000 was a permanent barrier rather than a good basis, therefore it's falling in value.
This past week the value shift saw that trend.
Over the weekend, Bitcoin fell below $80,000, hitting a low of $79,280 before a small rebound.
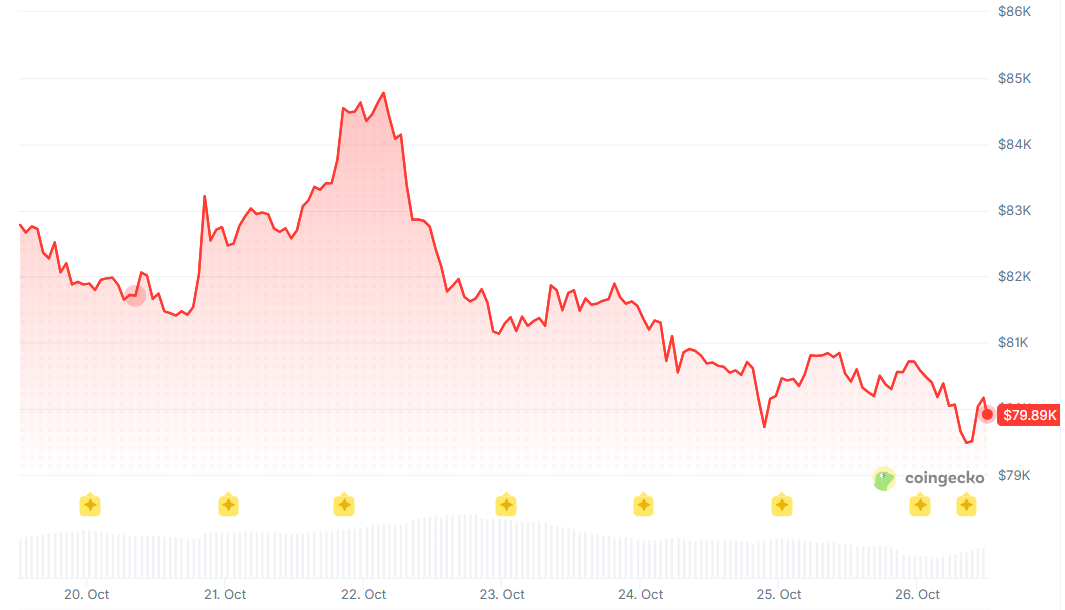
Bitcoin and Ethereum were the most liquid assets, with almost $400 million in long positions liquidated in just four hours.
A substantial $442.6 million left spot Bitcoin ETFs through the course of the week, with a particularly huge outflow of $635.5 million on October 22 - the biggest single-day withdrawal since June - standing out. In a significant fall, Ethereum funds lost $224.96 million out of a total of $14.5 billion in assets.
A breakdown in technical support, withdrawals of funds, and liquidation spirals make up the larger narrative. There is more complexity to the storyline at its core.
Bitcoin is in a tricky situation right now because of the Federal Reserve's lack of direction on its future moves and the credit crunch caused by artificial intelligence , which is causing risk capital to flee the market altogether, including cryptocurrency.
The Warsh Put That Wasn’t
Bitcoin was expected to be most affected by Kevin Warsh this month.
During his address to the IMF meetings in Bangkok on October 16, the chair of the Federal Reserve declined to commit to anything regarding the outcome of the forthcoming meeting on October 27-28.
Despite the robust 0.33% month-over-month increase in the September core CPI, Warsh chose not to bolster the hawkish argument , saying, "I will not prejudge the meeting result."
The market saw that as a signal of a more accommodating attitude.
The dollar fell as the likelihood of an October hike fell from over 25% to about 15%, while risk assets like Bitcoin saw a little upswing.
The rationale was obvious: the central bank may have finished its tightening cycle with the 25-basis-point hike in September, pushing rates to 3.75%-4.00%, assuming Warsh refrains from aggressively endorsing the inflation figures.
About seven days passed during that investigation.
Market investors will closely examine Warsh's language for clues regarding a possible future increase, however Bloomberg reports that the upcoming meeting is expected to take a break as of October 24.
The pause is not the problem. The crypto markets seem to have adapted to Warsh's deliberate dismantling of the forward guidance structure.
It is becoming more difficult to assess and control the sensitivity of Bitcoin's rate without a trustworthy reaction function.
This was brought to light by Coinbase's institutional desk : although Bitcoin's sensitivity to interest rates is still substantial, its correlation with semiconductor stocks is less than half of what it was in January.
As the 2-year yield jumped in response to the announcement of the September Consumer Price Index, Bitcoin saw a precipitous fall, falling from about $83,800 to below $82,000 in the span of hours.
The asset's role as a stand-in for technology is no longer fulfilled.
In a market where clarity on liquidity prospects has recently declined, it is serving as a tool for long-term liquidity.
The ETF Flow Mirage
Upon closer inspection, a new angle emerges from the headline of $442.6 million in weekly ETF outflows , which initially appears troubling.
There have been net inflows of more than $57 billion into US spot Bitcoin exchange-traded funds since their launch, bringing the total assets to between $104 and 105 billion.
One shouldn't use a weekly decline of less than 1% as a solid exit signal; it's just noise.
Nonetheless, the material is of utmost importance.
The largest weekly inflows and outflows were recorded by BlackRock's IBIT, suggesting that the headline figure is more indicative of BlackRock's clientele than of Bitcoin's marginal demand.
Concerns over artificial intelligence fundraising prompted a broader selloff in stocks on October 22, which included a withdrawal of $635.5 million.
CoreWeave fell 15.5% for the week, while Nvidia's Jensen Huang pointed out a "scarcity of capital."
The same institutional investors that own IBIT also lower their exposure globally when the AI market undergoes a slump.
What a peculiar situation Ethereum ETFs provide.
A multi-week pattern has persisted in the last weekly outflow of $224.96 million, which has a proportional impact around three times larger than Bitcoin's outflows when weighed against an asset base of $14.5 billion.
For months, the ETH/BTC ratio has been falling, and according to the ETF flow statistics, institutional investors are not seeing Ether as a main investment but rather as a higher-risk, lower-confidence asset.
The $79,800 Tripwire
Unsettlingly, the weekend price fluctuations validated the $79,821 threshold that Bitfinex specialists had previously identified as a potential catalyst for forced selling.
The fall of Bitcoin to $79,280 was not an irrational swing, but rather a planned move.
It looked at the region where leveraged positions from the upsurge in September and October are most vulnerable.
The vulnerability is shown by the technical illustration.
Right now, Bitcoin is trading below all five of the short-term moving average s: the 7-day simple moving average is at $82,083, the 20-day at $82,621, the 50-day at $81,845, and both exponential moving averages are in the $82,100-$82,270 region.
Any recovery will be painfully slow because every level in that cluster shifts from support to resistance as the price stays below it, creating a tiered ceiling.
At $72,941, the 200-day simple moving average is far lower than the Bollinger Band's lower border, which is around $79,966.
At these levels, the 200-day moving average does not offer much tactical support, but the overall trend it indicates is still strong.
Breaking the lower boundary with a daily close below $79,578 would set the stage for a move into the $78,000-$78,600 level, where there would be little technical support until the mid-$70,000s.
A seasonal flavor is introduced by October's monthly performance .
With a fall of almost 4.5 percent this month, Bitcoin might have its worst October since 2018 and could have its first negative performance in back-to-back months since 2011–2012.
At the start of the month, the general consensus changed from being positive to something more along the lines of a major repositioning.
What the Retail Bid Is Hiding
Beyond the price fluctuations, KuCoin's on-chain data shows a discrepancy that needs more investigation.
Retail net inflows of BTC to major exchanges have surged in the past month, reaching a six-month high of $10.75 billion, up significantly from $5.5 billion.
Compared to $5.9 billion at the end of August, whale inflows had dropped significantly to $3.8 billion.
Consumers are capitalizing on the market slump, according to the optimistic view.
Retail money flows into exchanges, according to the gloomy view, and this usually means that selling is about to happen, particularly if the inflows are concentrated during recovery efforts.
The $80,000–$86,000 range becomes a distribution zone instead of an accumulation zone if the retail bid is actually getting ready to sell during strong times and buy during bad ones.
A cautious outlook is supported by Coinbase's premium statistics .
With the seven-day average hitting its lowest point since August, Bitcoin has maintained a discount on Coinbase compared to Binance throughout the month.
Higher price points are not acceptable to American customers.
Offshore and retail demand make up the bulk of marginal demand, which has a track record of indicating weaker positions and faster capitulation when support levels are broken.
The Week That Decides the Range
There are a plethora of noteworthy events happening this week.
All three major central banks - the US Federal Reserve, the ECB, and the BOJ - have released statements detailing their policy decisions.
American core PCE, preliminary Q3 GDP, and unemployment claims are all scheduled for release in the near future.
Each of Warsh, Lagarde, and Ueda has a press conference.
Key Events This Week:
— The Kobeissi Letter (@KobeissiLetter) October 25, 2026
1. September New Home Sales data - Tuesday
2. October Fed Meeting and Rate Decision - Wednesday
3. Microsoft, $MSFT , and Alphabet, $GOOGL , Report Earnings - Wednesday
4. September PCE Inflation data - Thursday
5. US Q3 2026 GDP Data - Thursday
6.…
For nearly two weeks, Bitcoin's price has ranged from $80,000 to $86,000, but this low-volatility compression could be broken by any of these events.
It would seem that the market is not bracing for a major decline.
The DVOL index has risen to the 84th percentile of its 90-day range, reflecting an increase in hedging demand, but Bitcoin's implied volatility is still at record lows. Instead of betting on a slump, options traders are hedging their bets.
That shows that the market is not expecting a clear trend but rather erratic movements within a narrow range.
Bitcoin needs two things that aren't there right now for it to get back to the $82,000-$83,000 range: a Warsh press conference that doesn't bring up the possibility of rate hikes again, and an AI-related credit market that stops leaking.
Both choices are not guaranteed.
A managed retest or a possible slide toward the $72,000-$74,500 region, where the ETF break-even point lines up with the 200-day moving average, may be distinguished at the $79,800 mark, a significant threshold.
The coin itself is unrelated to the crypto market's problem this week.
Over the last three months, Bitcoin has proven that it can endure stricter regulations without crashing.
Nevertheless, Warsh's unpredictable behavior has been a challenge for the market in terms of quantifying variables.
The $80,000 is not a stable basis until that uncertainty goes away.
What Other Technical Readings Show
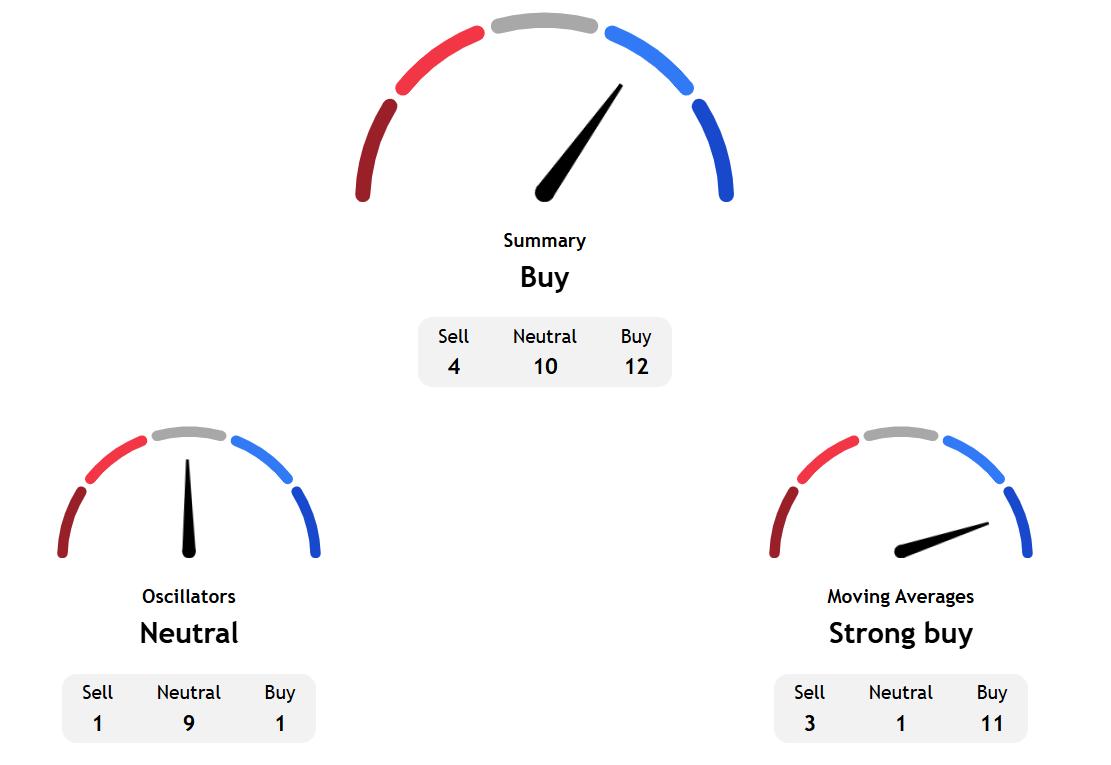
TradingView's technical analysis overview for the coming week based on key data from moving averages, oscillators, and pivots pointed to a buy signal.
While the long-term measures under moving averages showed a strong buy, the short-term indicators under oscillators pointed to a neutral stance.
Separately, InvestTech's Algorithmic Overall Analysis and one to six weeks recommendation showed a negative score.
The research saod, "Investors have accepted lower prices over time to get out of Bitcoin and the currency is in a falling trend channel in the short term. This signals increasing pessimism among investors and indicates further decline for Bitcoin. It also gave a negative signal from the rectangle formation at the break down through the support at $82,248. Further fall to $79,109 or lower is signaled."
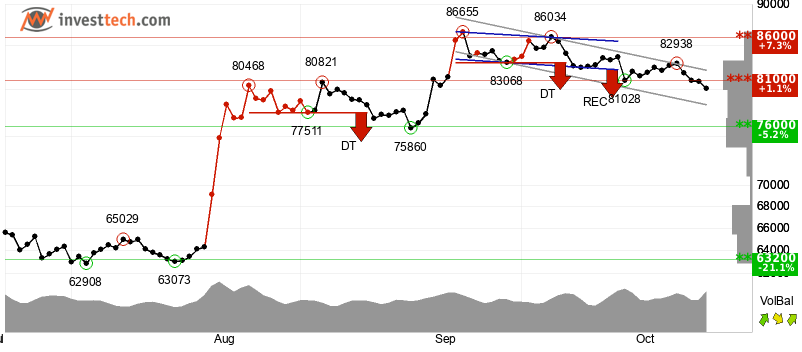
InvestTech added, "The currency has broken down through support at $81,000. This predicts a further decline. In case of positive reactions, there will now be resistance at $81,000. The RSI curve shows a falling trend, which supports the negative trend. The currency is overall assessed as technically negative for the short term."