
XRP is trading at $1.31, down 4.4% over the past 24 hours, after more than six billion tokens moved onto exchanges over the trailing month — the heaviest inflow reading in seven months. CryptoQuant counts 6.05 billion XRP in 30-day exchange inflows, with Binance alone taking in 2.46 billion of it. The immediate question is whether that wave is selling pressure hitting order books, or ordinary market plumbing. Read carefully, the data points somewhere in between.
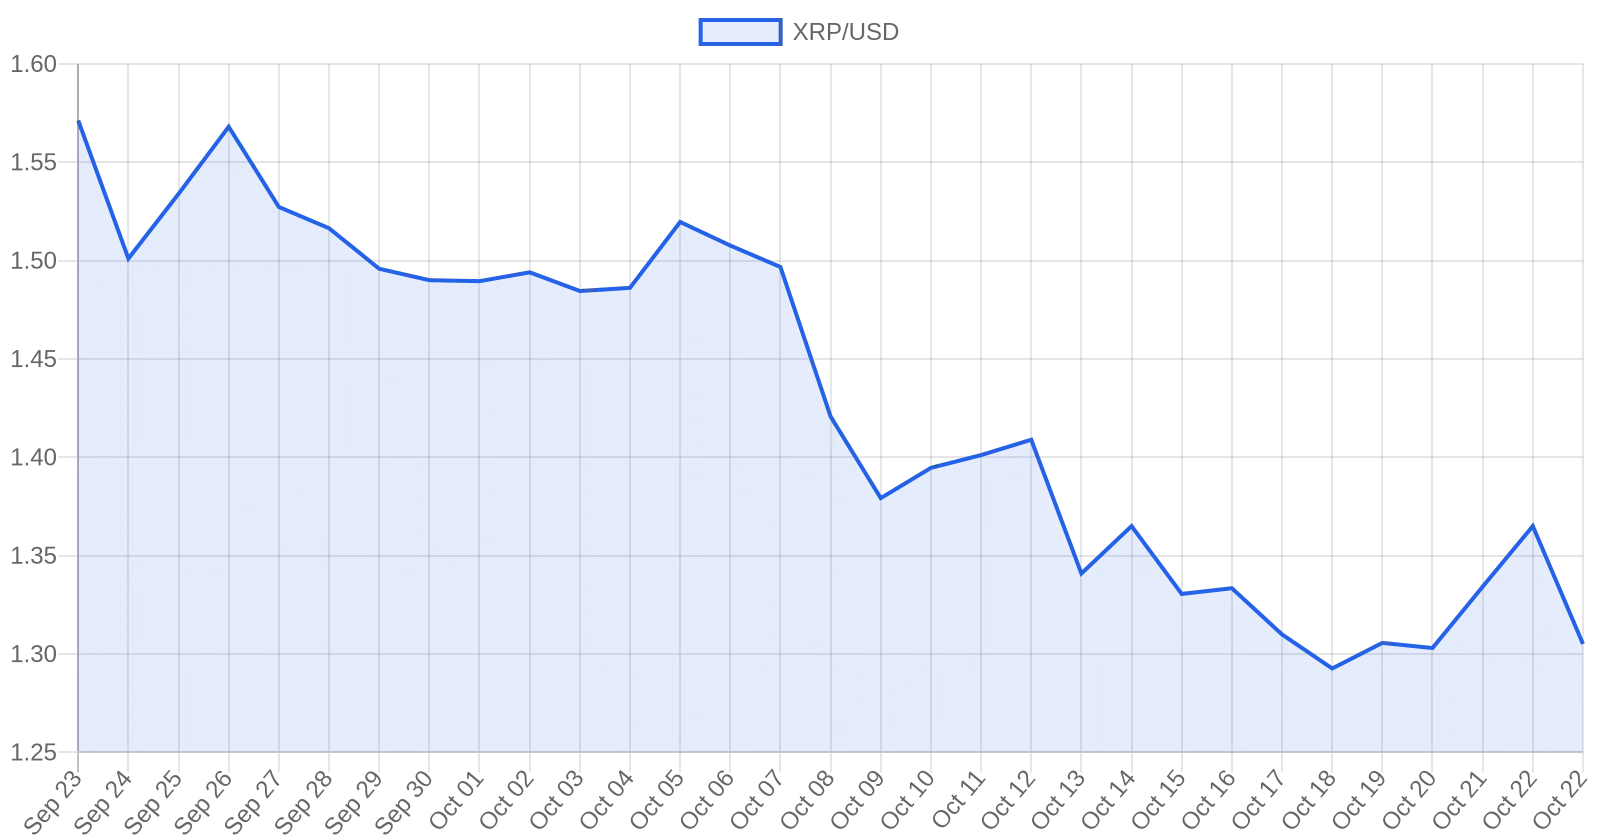
As of 23:37 UTC on October 22, XRP changed hands at $1.31, down 4.40% over 24 hours, with a market capitalization of $82.38 billion, good for fifth place among crypto assets, per CoinGecko . The 24-hour range ran from a low of $1.30 to a high of $1.37 on about $1.57 billion of volume. Over the past month the token has shed roughly 16% from its September 23 level near $1.57, and it sits about 64% below the all-time high of $3.65 it set in July 2025.
A 6.05 Billion Token Wave, Exchange by Exchange
The headline number comes from CryptoQuant’s QuickTake platform, where analyst Arab Chain traced XRP movement onto centralized venues. “There has been a notable surge in XRP inflows to cryptocurrency exchanges, with the total volume reaching approximately 6.05 billion XRP over the last 30 days, the highest level in seven months,” the analysis reads.
The breakdown matters because it shows where the supply is landing. Binance absorbed the largest share at roughly 2.46 billion XRP, about 40.7% of the total. Bybit took in about 580.31 million, OKX 557.13 million, Upbit 544.48 million, Bitget 284.52 million, KuCoin 55.24 million and Gate 29.47 million. In dollar terms, 6.05 billion XRP at $1.31 is just under $7.93 billion in tokens that moved toward venues where they can be sold quickly.
The inflow spike arrives against a steadily declining price. The chart below plots XRP’s daily close over the trailing 30 days: the token has printed lower highs since late September, sliding from $1.57 down to the current $1.31 area.
Why Inflows Don’t Automatically Mean Selling
CryptoQuant is explicit that the metric is not a sell signal. “It should be noted that an increase in XRP inflows to exchanges does not necessarily mean that investors are preparing to sell,” the analyst writes, adding that “interpreting this indicator becomes more accurate when compared with XRP’s price action, trading volume, and exchange outflows.”
The distinction is more than semantics. A transfer to an exchange can reflect custody moves, active trading, or wallet reshuffling — not a decision to dump. And the scale, while large in absolute terms, is a modest slice of the float: 6.05 billion tokens equals roughly 9.6% of the 63.1 billion XRP in circulating supply. A market that absorbed nearly a tenth of its circulating supply landing on venues in a single month, and only gave up about 16% from its September high, is not showing the hallmarks of a supply cascade.
The exchange-side picture is also softened by what is happening on the fund side. U.S. spot XRP ETFs were the demand story this autumn, though that streak cooled in recent days: the funds ended a 13-week run of consecutive weekly inflows in mid-October, a shift BlockchainReporter covered when spot XRP ETFs ended their 13-week inflow streak . With both daily ETF flows and price softening, the $1.30 level has become the line in the sand.
The Levels That Matter Now
On the technical side, XRP’s immediate floor is the October 22 intraday low of $1.30, which also marks the 24-hour low across major venues. A break below it opens the way toward the October 18-19 lows near $1.29, the weakest prints of the month. On the upside, $1.37 — the October 22 high — is the first resistance, and above that sits the $1.40 round number where XRP has repeatedly failed over the past week.
These levels are drawn from the observed 24-hour and weekly ranges, not from a forecast. A daily close back above $1.37 would be the first sign that the inflow wave has been absorbed; a close below $1.29 would suggest supply is still clearing. Neither outcome is guaranteed by the flow data alone, which is the point CryptoQuant makes when it insists the indicator be read next to price and volume rather than in isolation.
The Wider XRP Picture
Away from the order books, two threads frame the next several weeks. The XRP Ledger’s fixCleanup3_4_0 amendment lost the validator support it needed to activate on schedule, pushing the network’s cleanup change later into November and underscoring that the ledger’s own upgrade cadence runs independently of the token’s price. Meanwhile, XRP remains the asset at the center of Ripple’s long-running regulatory fight with the SEC, which continues to shape how institutions weigh the token.
For a longer horizon, the XRP price prediction case rests on a different set of drivers — ETF flows, ledger utility, and the resolution of the SEC dispute — rather than the month-to-month movement of tokens onto exchanges. The inflow print is a snapshot, not a verdict.
Frequently Asked Questions
XRP traded at about $1.31 on October 22, 2026, down 4.40% over 24 hours, with a market capitalization of roughly $82.38 billion, according to CoinGecko.
XRP fell as CryptoQuant reported 6.05 billion XRP in 30-day exchange inflows, a seven-month high, while spot XRP ETF inflows cooled after a 13-week streak ended.
No. CryptoQuant notes that inflows can reflect custody moves, trading, or wallet transfers, and says the metric must be read alongside price action, volume, and outflows.
Immediate support sits near $1.30, the October 22 low, with the October low around $1.29 below it. Resistance starts at $1.37, then the $1.40 level where the token has repeatedly failed.
6.05 billion XRP equals roughly 9.6% of the 63.1 billion XRP in circulating supply, worth about $7.93 billion at $1.31 per token.
Data: CoinGecko , Binance , CryptoQuant .
Disclosure: This article does not represent investment advice. The content and materials featured on this page are for educational purposes only.