
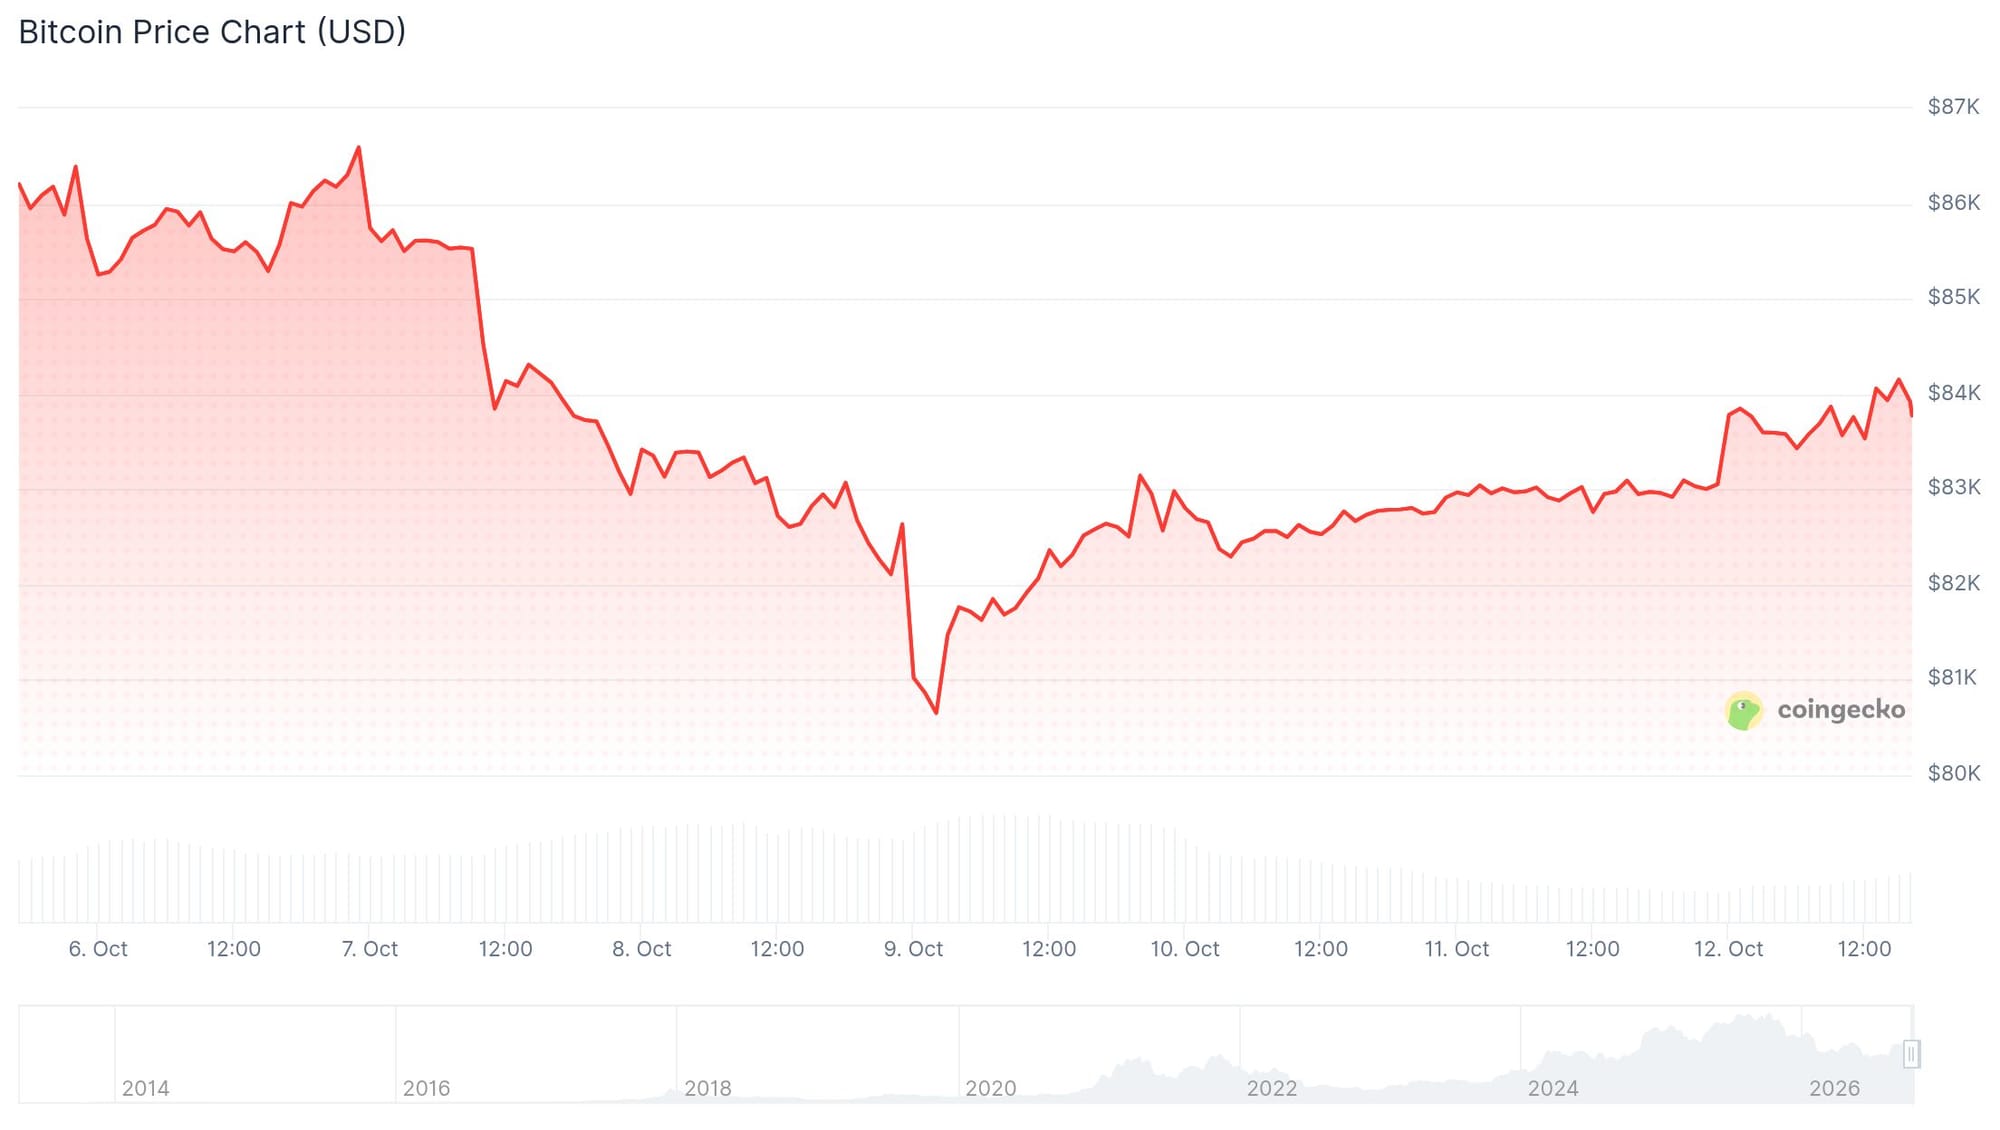
Bitcoin is now trading over $83,000, and the Fear and Greed Index has risen to 68, firmly in the "Greed" territory for the past month.
Risk appetite seems to be returning.
The surge, driven by ETF inflows and economic hopes, is extremely fragile internally, although the index doesn't fully reflect this.
Ethereum ETF outflows differ significantly from Bitcoin outflows.
The 'Selective Return' of ETF Flows
US spot Bitcoin exchange-traded funds saw a dramatic change in fortunes around the middle of September.
There was a significant change from cumulative net outflows of $5.8 billion year-to-date in July to net inflows of around $934 million by late September, with over $3 billion coming in eight days.
An astounding $1.2 billion poured into BlackRock's IBIT in the span of a week, while $702 million poured into Fidelity's FBTC.
As a result of that rise, Bitcoin's price jumped from below $80,000 to approximately $87,000 again.
As October began, the pattern turned around again.
The largest one-day net outflow since June 25th occurred on October 8, reaching $484.9 million. A further $244 million was removed the day after that.
The most prominent assets that were withdrawn were FBTC (Fidelity) and IBIT (BlackRock).
The underlying dynamics of contemporary ETF flows are revealed by this "surge in, retreat fast" pattern. Rather than reflecting long-term structural allocations, they reflect macro trades.
According to Crypto Briefing , hedge funds may have taken a back seat.
On the other hand, Motley Fool said that basis trades – buying ETF shares and shorting futures to profit on the spread – may have contributed to some of the inflows. That kind of money reacts very quickly to interest rate forecasts.
There is a general trend for the macro environment to change at a faster rate than it came.
Macro 'False Breathing Room'
It was easy to see the main reason for the influx. To control liquidity in light of increasing bond yields, US Treasury Secretary Bessent unveiled a plan to increase bond purchases in August.
Bitcoin has been positioned by the market as a hedge against inflation and interest rate volatility.
On the other hand, the backing from the macro is starting to fade.
Despite a downward adjustment to August's numbers, nonfarm payrolls added just 29,000 jobs in September, much below expectations.
There is no pressing need to increase rates, according to Fed Vice Chair Jefferson and Governor Bowman.
There has been a marked decrease in market price for an increase in October, with December now seeming more likely. The problem is that a rise in risk assets cannot be sustained by only expecting peak rates.
Compared to its starting price of $87,722 at the beginning of the year, Bitcoin is now trading close to its opening price, ranging from $83,000 to $84,000. The " ETF average entry cost " and the prior technical peak, according to experts, will converge at $83,000.
The on-chain accumulation zone is at $77,000, and the 200-day moving average is near $72,000, so a breach of that level would signal that trend.
Ethereum: Structural Absence of an Institutional Narrative
Ethereum has experienced a notable recovery; nonetheless, when contrasted with Bitcoin, the amount of institutional involvement is far lower . As compared to Bitcoin ETFs, which have recovered around two-thirds of their outflows, Ethereum ETFs have only recovered around a third.
Bitcoin is being positioned by institutions as a "strategic balance-sheet allocation asset," with pricing characteristics that resemble commodities, according to research from JP Morgan.
This is the underlying reason for the gap.
The future of Ethereum is dependent on Layer 2 scalability, staking yield, and DeFi ecosystems, all of which are at odds with what institutional investors want: stability and liquidity.
By comparing Ethereum to Amazon in 2001 , Standard Chartered's Geoff Kendrick hoped to shed light on the misalignment between the price of ETH and its underlying network fundamentals.
Even if the number of transactions and total value locked in ETH are around record highs, the price has fallen about 57%. Another problem with that comparison is that in the end, cash flow and profitability were what Amazon's "internal metrics" measured.
Whether Ethereum's network activity can be used in a similar way is still up in the air.
Two major events must occur before Bitcoin's price can reach $150,000, and the Ethereum-to-Bitcoin ratio can rise from 0.03 to 0.04 for Tom Lee's $6,000 prediction to materialize .
This would require Bitcoin's value to nearly double in just two months at the current price levels.
Presently, the Kalshi prediction markets are pricing at 5%.
The Cost of Greed
On the Fear and Greed Index, a score of 68 can be deceiving. Instead of a strong capital structure, it shows price momentum.
A combination of factors , including Bitcoin ETF flows' unpredictable volatility, Ethereum's lack of an appealing institutional story, and XRP and Dogecoin's dependence on market sentiment, suggests that the current risk appetite is more tactical than strategic.
The $83,000 price of Bitcoin is in the middle of the pack between the ETF cost line and its price at the beginning of the year.
The possibility of further Federal Reserve rate hikes may decrease if the Consumer Price Index report on October 14 shows that inflation is under control, which might offer risk assets a short reprieve.
But if the CPI surprises lower than expected, investors may sell their ETF holdings faster due to the unwinding of basis bets, sending Bitcoin soaring toward the on-chain accumulation zone of $77,000.
These fundamental problems go unnoticed by the Greed Index. The movement of capital will.
What Other Technical Indicators Show
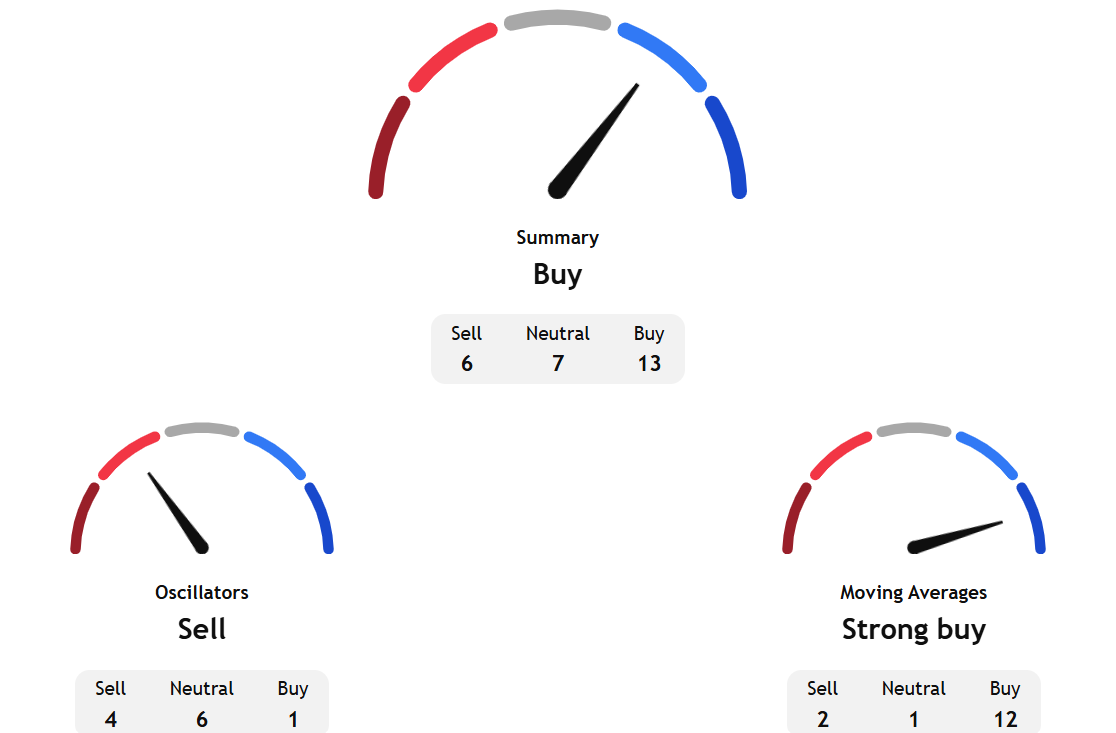
TradingView's technical analysis overview for the coming week based on key data from moving averages, oscillators, and pivots points to a buy signal.
While long-term sub indicators show strong buy bias, short-term gauges of oscillators point to a sell signal.
Separately, InvestTech's Algorithmic Overall Analysis gave a hold score, and the research gave a weak negative score for its one-six week recommendation.
InvestTech said, "Bitcoin has broken through the floor of a rising trend channel in the short term. This indicates a slower rising rate at first, or the start of a more horizontal development. The currency is moving within a rectangle formation between support at $82,357 and resistance at $85,672. A decisive break through one of these levels indicates the new direction for the currency."
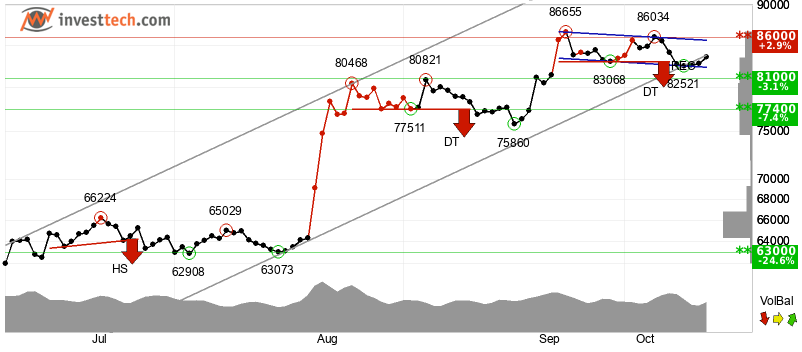
The research added, "The currency has support at points 81000 and resistance at points 86000. The RSI curve shows a falling trend, which could be an early signal of the start of a falling trend for the price as well. The currency is overall assessed as technically slightly negative for the short term.”