
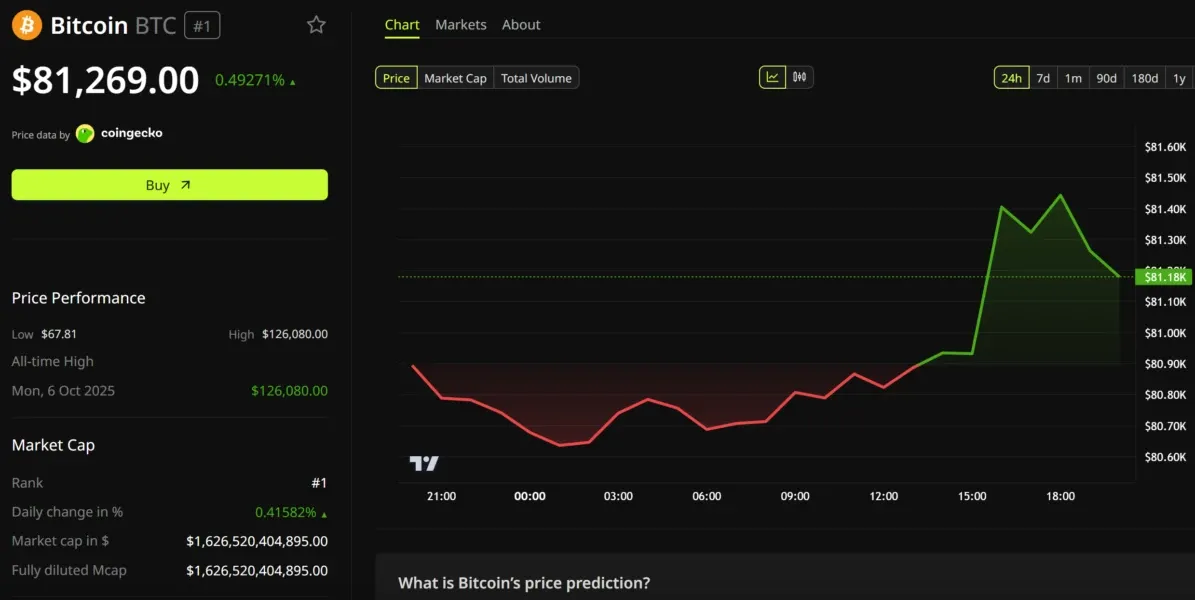
Over the weekend, Bitcoin surged beyond $81,000, prompting traders to exercise caution as political tension and inflation data meet this week.
According to Fibonacci forecasts, the next technical goal is $83,400, and an increasing RSI indicates that momentum is still building. Bitcoin is currently holding firm above $80,000, but traders are still waiting for a possible fall as the cryptocurrency returns to a familiar chart pattern.
Looking ahead, it appears like things are expected to continue on an upward trend. It seems like Bitcoin is waiting for the US CPI data to come out before making any moves.
Following a rather calm weekend, according to recent data from TradingView, the price of Bitcoin is on an upward track, having avoided a plunge below $80,000.
Market players have now reiterated their belief that Bitcoin must retest support levels, following a midweek rise that was unable to be sustained and a spike that approached $83,000.
Importantly, two moving averages were placed just below the $80,000 level, forming a support zone for the bull market.
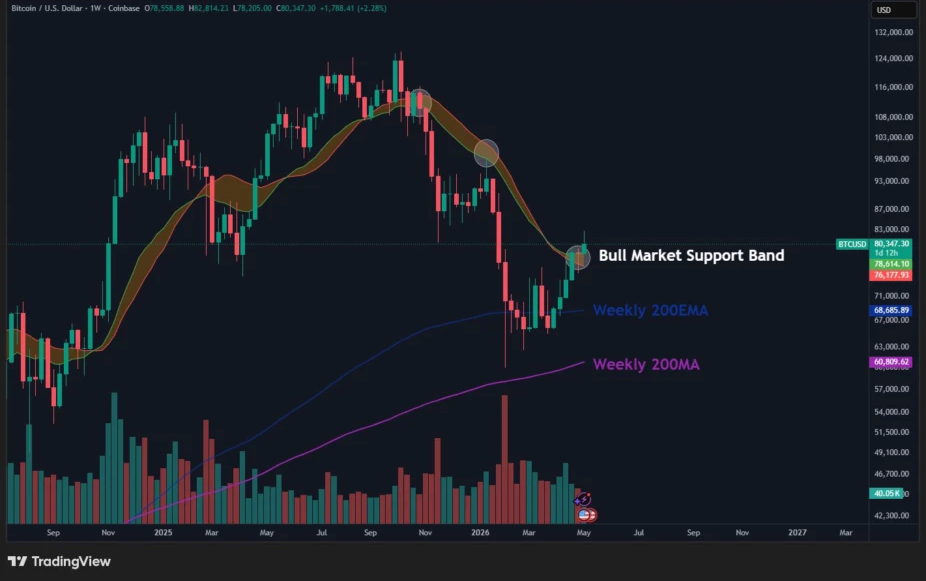
After the high-timeframe resistance level was rejected, it is likely that a short-term pullback into the 2D Bull Market Support Band will be observed.
According to a recent post on X by the analytics account Cryptic Trades, which included a graphic, this zone has shown considerable reversal potential in the preceding several months.
The low-timeframe accuracy one single tool can provide is actually insane. $BTC https://t.co/qNW6g5zawr pic.twitter.com/GCGVzte0X8
— Cryptic Trades (@CrypticTrades_) May 10, 2026
Geopolitics vs. Trends
US President Donald Trump asserted that Iran has been misleading America for 47 years. Former President Barack Obama was singled out by Trump in a letter, which said that Iran received billions of dollars from the Obama administration, including $1.7 billion in hard currency.
According to Trump, the regime was totally unprepared to deal with the transfer, which he described as a win. According to the president, it was a vital source of revenue for Iranian authorities. Trump chose not to announce any more military operations or sanctions.
These remarks were made at a time when the cryptocurrency markets were paying close attention to geopolitical issues, as Bitcoin's weekend rise was approaching resistance around $81,000.
Crypto Outlook
At its current price of above $81,000, Bitcoin is still in the midst of a month-long uptrend and is very close to the $82,036 resistance mark, which is the 200-day exponential moving average (EMA).
Following a dip to roughly $60,000 in February, the asset rose over 35% thanks to renewed interest in spot Bitcoin ETFs. Bitcoin pauses slightly beneath a long-term trend line, which has hampered every rally attempt since late January. However, momentum indicators show a range of indications.
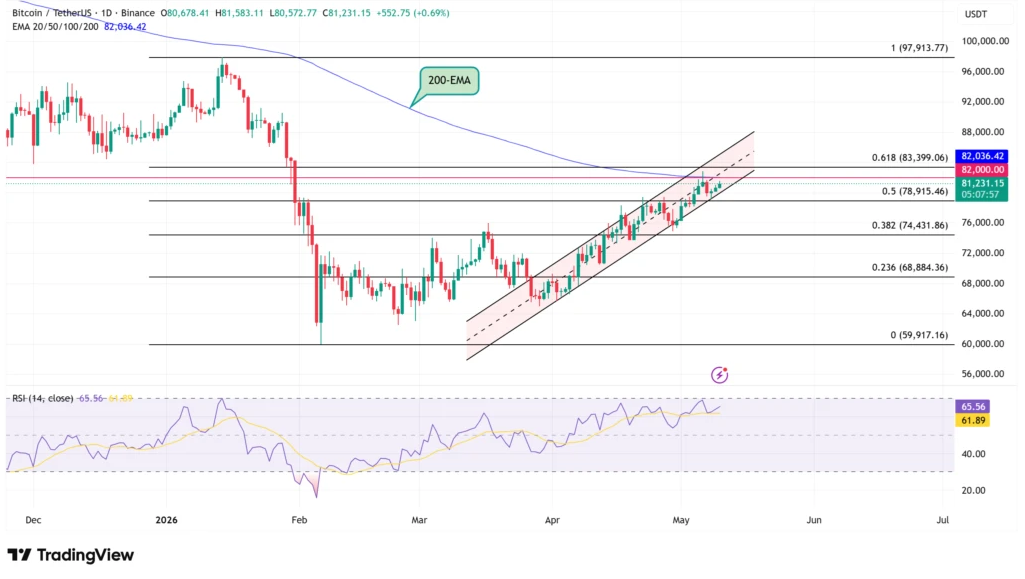
According to TradingView, Relative Strength Index (RSI) readings of 65.56 and 61.89 on the daily chart are in line with one another. Both numbers are above the neutral 50 line, which means that buyers are controlling the price movement in the near term. This momentum reading tracks the steady recovery of Bitcoin price after its February slump.
In line with the contemporaneous recovery observed in BeInCrypto's negative market research, the RSI has been rising consistently since its short drop into oversold territory three months ago.
Having said that, there is a word of warning regarding this current vitality. Right now, the indicator is displaying its highest value since the slide started in January, and crossing the 70 barrier indicates entering overbought territory.
According to historic data, a daily RSI above 70 usually suggests that Bitcoin is about to have a short-term correction. Validation through volume confirmation is necessary for a clear breakout. A bearish divergence between the price and momentum peaks may form if buyers can't increase the RSI over 70 while the price stays below the 200-day EMA. The signal would be reversed and sellers would be confirmed to be in control of the trend if the daily RSI closing fell below 50.
Since early April, when it was trading around $60,000, Bitcoin has been following a clearly defined rising trend. Throughout the uptrend, the price action has faithfully followed the channel's midline, which has attracted buyers inside the defined framework at each retracement.
At $82,036, the 200-day exponential moving average now acts as resistance. During the breakdown from January to February, this level has continuously resisted price changes, which is in line with a large supply area. Confirming the May projection proposed by many experts, Bitcoin would make its first return to this trend line in over four months if the daily close was above $82,036.
The 61.8% Fibonacci retracement at $83,399 would be a plausible next goal for Bitcoin if it manages to exceed that obstacle. Located at the channel's upper end, this level forms a confluence location that might lead to profit-taking.
Assuming buyers are able to efficiently handle the supply at $83,400, a channel projection suggests a goal of around $86,500 in the upcoming weeks.
The $78,915 50% Fibonacci level marks the beginning of the bearish invalidation.
The channel structure might be disrupted and a possible retest of the 38.2% Fibonacci retracement at $74,431 could be possible if the daily close drops below this support level.
Following that, the 23.6% retracement at $68,884 is the final barrier before the recovery story falls apart, in keeping with the overall long-term prediction for BTC in 2026.
ETF Demand Still in Play
The primary motivator is the persistent need for spot ETFs. At the end of April, net inflows hit almost $2.7 billion over nine straight sessions, with the bulk of that total going to IBIT (BlackRock) and FBTC (Fidelity).
Despite the negative threats that were flagged earlier in 2026, the total assets in U.S. spot Bitcoin products have surpassed $100 billion, indicating persistent demand.
As a result, the lower channel boundary has been maintained.
In the next two weeks, Bitcoin will interact with the 200-day exponential moving average (EMA), and the result will determine the trend's direction going into June.
What Other Technical Readings Show?
TradingView's technical analysis overview based on key data from moving averages, oscillators, and pivots for the week ahead showed a neutral stance.
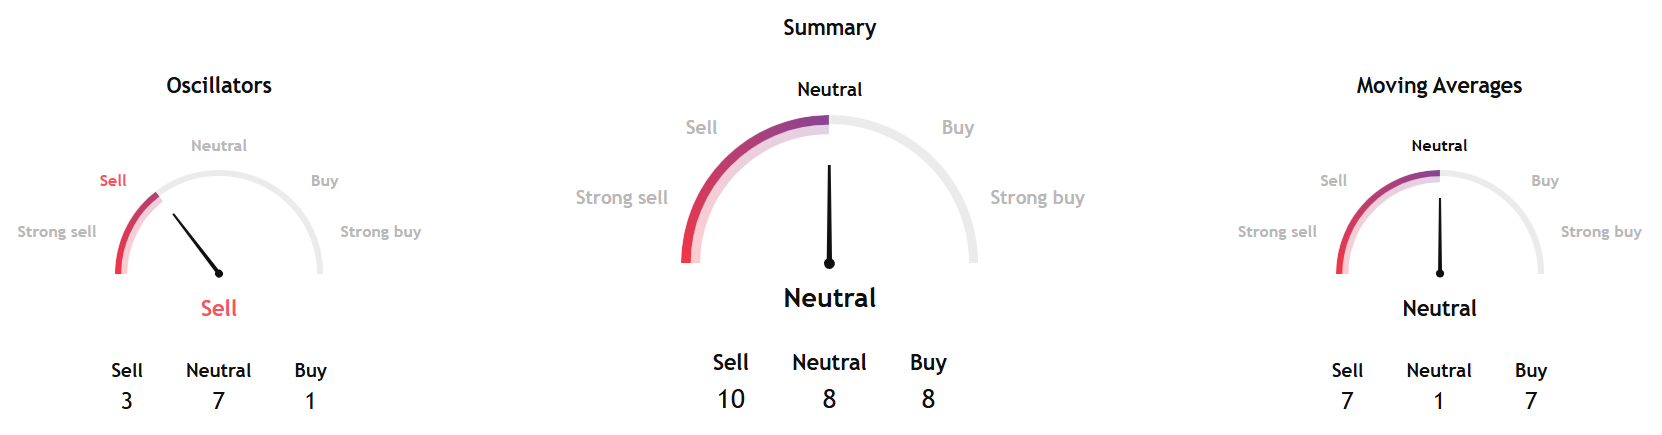
While the moving averages indicators showed a neutral signal, the oscillators reflected a sell signal.
Separately, InvestTech's Algorithmic Overall Analysis and one to six weeks recommendation gave a positive score.
The research said "Bitcoin shows strong development within a rising trend channel in the short term. Rising trends indicate that the token experiences positive development and that buy interest among investors is increasing. There is no resistance in the price chart and further rise is indicated."
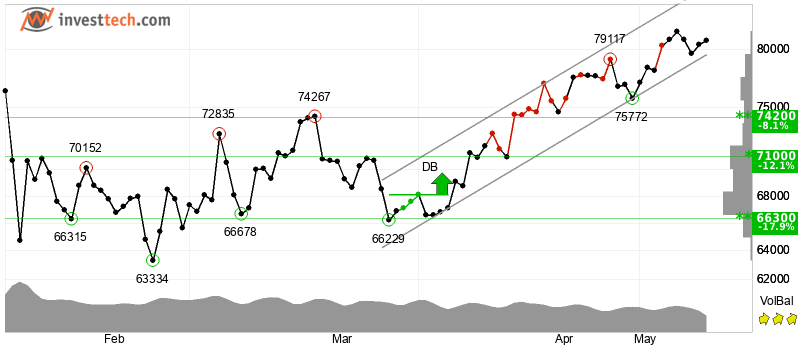
InvestTech added, "In case of a negative reaction, the token has support at approximately $74,200. RSI diverges negatively against the price, which indicates danger of a reaction downwards. The token is overall assessed as technically positive for the short term."