The continued presence of geopolitical concerns in the Middle East has kept Bitcoin and the broader cryptocurrency market at lower levels than last week.
The price of Bitcoin failed to hold $68,800 and is now settling just around $68,000, potentially trending downward. The top token had a 1% increase after a short drop on Saturday, when it fell below $65,000.
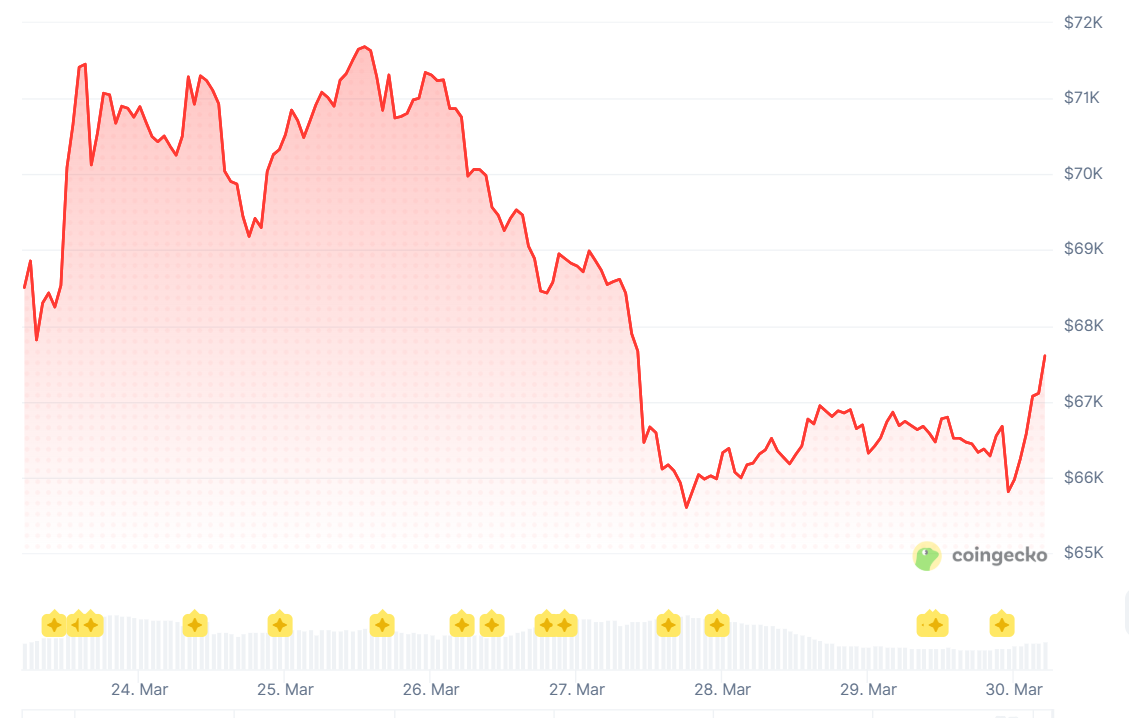
The price has leveled out, but it's still lower than last week's, when it hovered near $71,000. After reaching a high of $126,080 in October 2025, Bitcoin's pricee has fallen 47% to its current level.
Lower High or Lower Low?
After failing to sustain its upward pace over $71,200, the top token subsequently declined. Bitcoin's price has pared its gains and dropped below the $70,000 psychological support level.
According to TradingView, sellers pushed Bitcoin's price past $68,800 and $68,000, and further lower At $65,030, its price hit rock bottom, and it's now settling close to the 23.6% Fibonacci retracement mark of the fall from $71,985 high to $65,030 low.
The current price of Bitcoin is falling short of both the 100-hour simple moving average and the $68,000 mark. An observable declining trend line has formed on the hourly chart for the BTC/USD pair, indicating resistance at $67,250.
If the price remains stable over $65,750, a fresh upward trend would be possible. At around $68,000, we now have a level of resistance. The trend line and the $67,250 mark provide the first major obstacle. If the price can break over the $67,250 barrier mark, it might continue to rise.
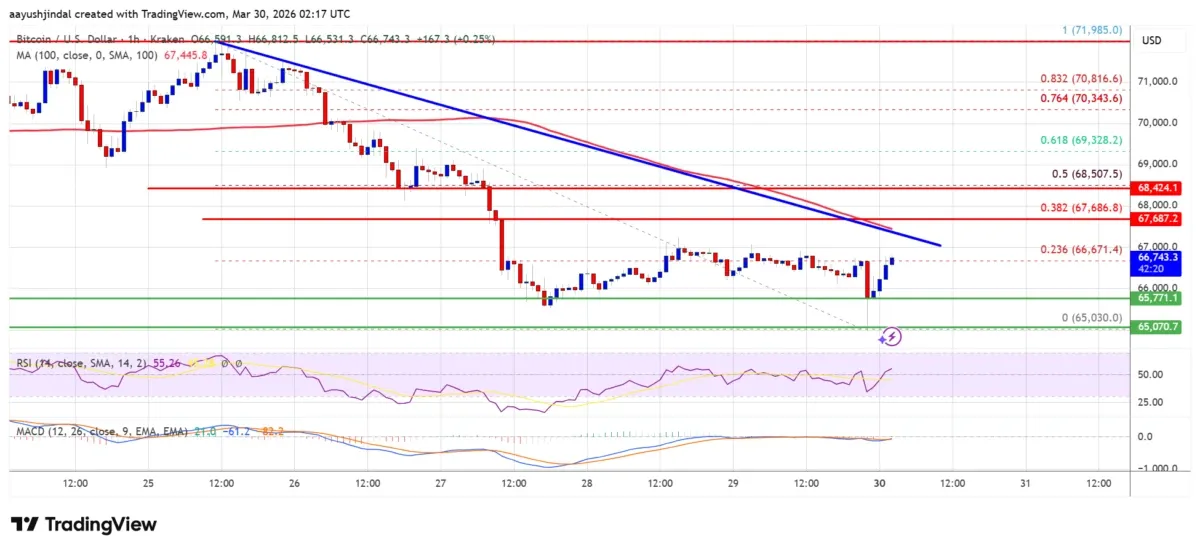
If prices rise, they may test the $68,500 level of resistance, which is also the 50% Fibonacci retracement level of the drop from the $71,985 high to the $65,030 low. If the momentum carries forward, Bitcoin can reach $69,200. But an impending obstacle of $70,000 may await the hopeful investors.
Should Bitcoin fail to surpass the $68,500 resistance level, it may initiate a new downward trend. The $65,750 level serves as proximate support. The $65,000 level is near the primary significant support.
The upcoming support level is currently around the $64,200 area. Further declines could potentially push the price down to the $64,000 support level in the short term.
The primary support level currently stands at $63,500; if BTC falls below this threshold, it may face challenges in regaining momentum in the short term.
"Extreme Fear": Escalation or Diplomacy Bets?
As a result of the events in the Strait of Hormuz, the Federal Reserve is hesitant to reduce interest rates due to growing inflationary fears. The subsequent effect is to drive down the value of cryptocurrencies.
Iran has initiated attacks on nearby Gulf nations, including Kuwait and Saudi Arabia, amid the continuing tensions with the U.S., while efforts for peace talks remain at a standstill.
The Bitcoin Fear & Greed Index, currently at a score of 9, indicates that the market remains in a state of "extreme fear."
Instead of a mild feeling of unease, this type of reading implies that market players are extremely risk-averse, are being forced to sell, and lack confidence in general. Markets almost never remain in this region for a long time without quickly reversing course or retreating.
The prevailing sentiment is reinforced by the movement in key assets. As Ethereum hovers near the $2,000 threshold, Bitcoin has retreated to the closer to $70,000 range after struggling to hold onto its previous highs. Both assets exhibits a similar pattern: diminishing peaks, resistance from descending moving averages, and weak, quickly diminishing recovery efforts.
When people are afraid, it might affect market positioning and liquidity. If confidence drops to that level, market players will cut back on risk, big companies will back off, and individual investors will draw back considerably.
With less money floating around in the market, price swings can get a lot worse. The rise in liquidations in recent times is indicative of the elimination of leverage. The present short-term trend is becoming more negative, which is boosting the volatility on the downside. On the other hand, intense apprehension isn't necessarily detrimental.
Typically, these scenarios arise near local lows, when the majority of sellers have already entered the market, rather than a sudden improvement in fundamentals.
The issue lies in the timing. Market conditions can remain stagnant or decline for an extended period before a significant turnaround takes place. Those who want to make money should be ready for ongoing volatility and deceptive signs.
In order to validate the possibility of short-term recoveries, it will be crucial to restore important moving averages and overcome resistance levels. Upward motions are only ever corrective unless that is present.
The market continues to experience volatility and is heavily influenced by news, with potential surprises that could propel Bitcoin to $70,000. Any reduction in tensions in the situation in Iran and subsequent easing in oil prices could potentially drive a surge beyond $70,000.
The Conundrum
Analysts have described the current situation as historically fascinating, since retail and institutional investors are now moving in different directions.
Investor sentiment is currently cautious. Every day, investors are either protecting their assets or remaining inactive. The perspective from institutions presents a completely different scenario. Following four months of negative total monthly flows, spot bitcoin exchange-traded funds in the US have witnessed remarkable inflows of over $1.13 billion.
Historical trends show that institutions are usually right when retail fear and institutional accumulation are significantly different. This doesn't necessarily mean that prices will go up tomorrow, but it does show that demand is strong, which is important for the next quarter's performance.
Expanding Middle East War & Risks
The situation surrounding BTC and other cryptocurrencies appears precarious as tensions rise with the escalation of the Iran conflict, particularly with the involvement of the Houthis and the arrival of US military personnel in the Middle East.
It appears that US President Donald Trump is aiming to secure the strategic Kharg Island and subsequently gain control over the Strait of Hormuz, a vital passageway for 20% of the world's crude oil supply.
Given the current circumstances, it is anticipated that crude oil prices will continue to increase in the coming weeks, leading to a rise in inflation in the US.
As a result, it remains plausible that interest rate hikes could be the way forward as the Fed maintains its hawkish approach, despite Trump and his chorus singing administration breathing down the neck of policymakers.
What Other Technicals Show
Certain gauges suggest that investors are giving in and liquidating their assets. According to data gathered by SoSoValue, spot Bitcoin ETFs experienced a decline of more than $296 million in assets last week, breaking a four-week trend of inflows during which these funds accumulated over $2.2 billion.
The recent weeks have seen a steady increase in Bitcoin’s futures open interest, indicating a potential decline in demand.
The open interest has consistently held at $48 billion, maintaining this level over the past few months.
The current figure is significantly below the peak of over $95 billion reached last year.
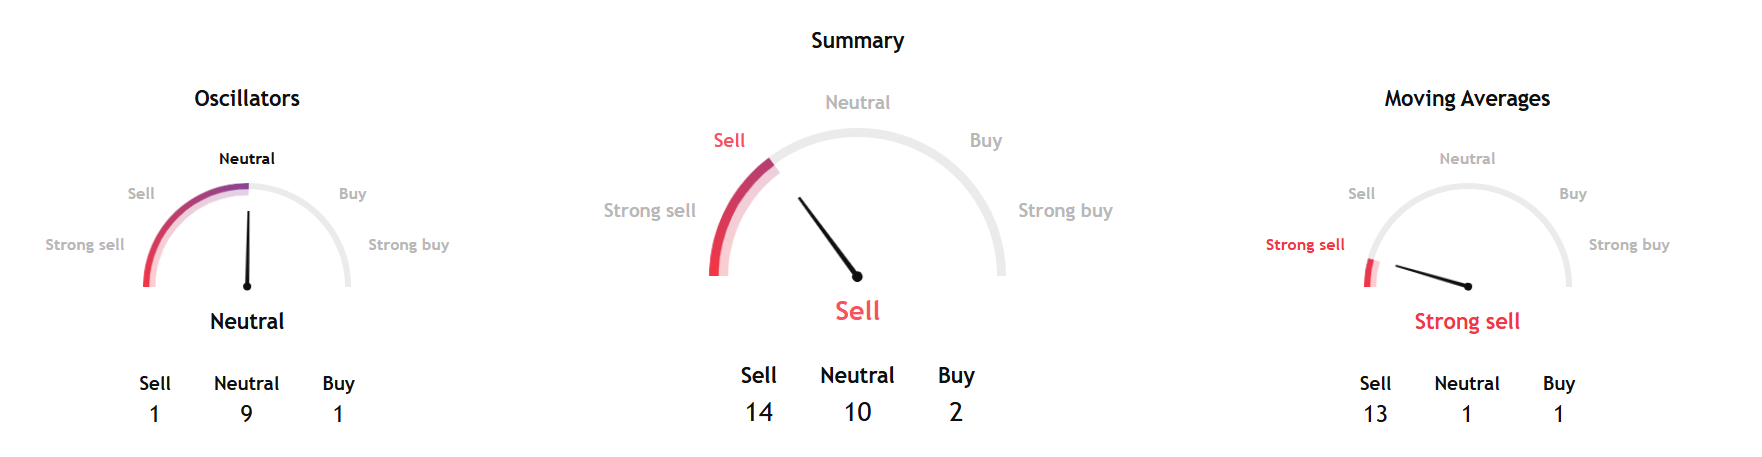
TradingView's technical analysis overview for the coming week, based on key data from moving averages, oscillators, and pivots, showed a sell signal.
The short- and long-term gauges also showed a similar trend.
On the other hand, InvestTech's Algorithmic Overall Analysis and the one to six weeks recommendation gave a hold or positive score.
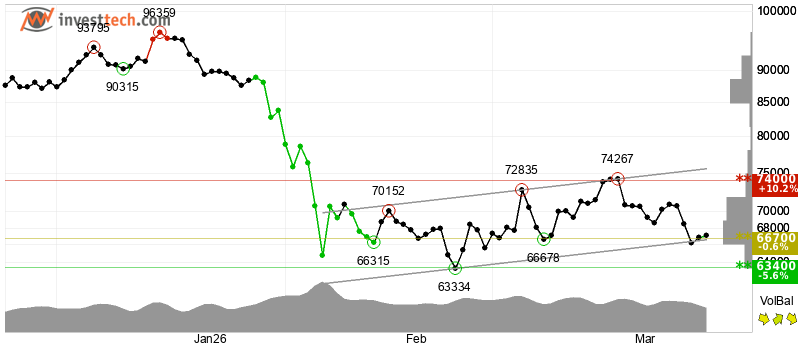
InvestTech said, "Bitcoin shows strong development within a rising trend channel in the short term. This signals increasing optimism among investors and indicates a continued rise. The token is testing support at $66,700. This could give a positive reaction, but a downward breakthrough of $66,700 means a negative signal."
The research noted, "Volume tops and volume bottoms correspond well with tops and bottoms in the price. This strengthens the trend. An RSI below 30 shows that the momentum of the token is strongly negative in the short term. Investors have steadily reduced the price to sell the currency, which indicates increasing pessimism and continued falling prices."
"However, particularly in big stocks, low RSI may be a sign that the stock is oversold and that there is a chance for a reaction upwards. Bitcoin is overall assessed as technically positive for the short term," added InvestTech.
Be at the heart of TradFi–DeFi collaboration at Money20/20 Asia 2026 .
Are you looking to forge partnerships with banks and fintechs? To expand into new markets across Asia, or to secure funding from top-tier investors? This April, the world of digital assets, blockchain, and Web3 converges with the biggest players in APAC’s financial ecosystem at Money20/20 Asia 2026 and its brand new ‘Intersection’ zone, complete with a dedicated content stage, TradFi-Defi innovator showcase, and curated networking spaces. From traditional banking giants to decentralised innovators, private equity leaders, and cutting-edge fintech disruptors, this is where they meet to forge partnerships, spark dialogue, and shape the future of finance.