Bitcoin is nearing a level on the MVRV ratio that historically lines up with market “undervaluation,” according to CryptoQuant contributor Crypto Dan, as traders look for signs that a four-month drawdown from October 2025’s all-time high is shifting from distribution into accumulation.
Is Bitcoin Undervalued?
In a post on X, Korean Dan said Bitcoin is “approaching the undervalued zone,” arguing that the market is getting close to a threshold that has often marked compelling risk-reward for longer-horizon buyers.
“After reaching its all-time high in October 2025, Bitcoin has been declining for approximately 4 months and is now approaching the undervalued zone,” he wrote. “Generally speaking, when the MVRV ratio falls below 1, Bitcoin is considered to be undervalued. The current value is around 1.1, which can be seen as being close to the undervalued zone.”
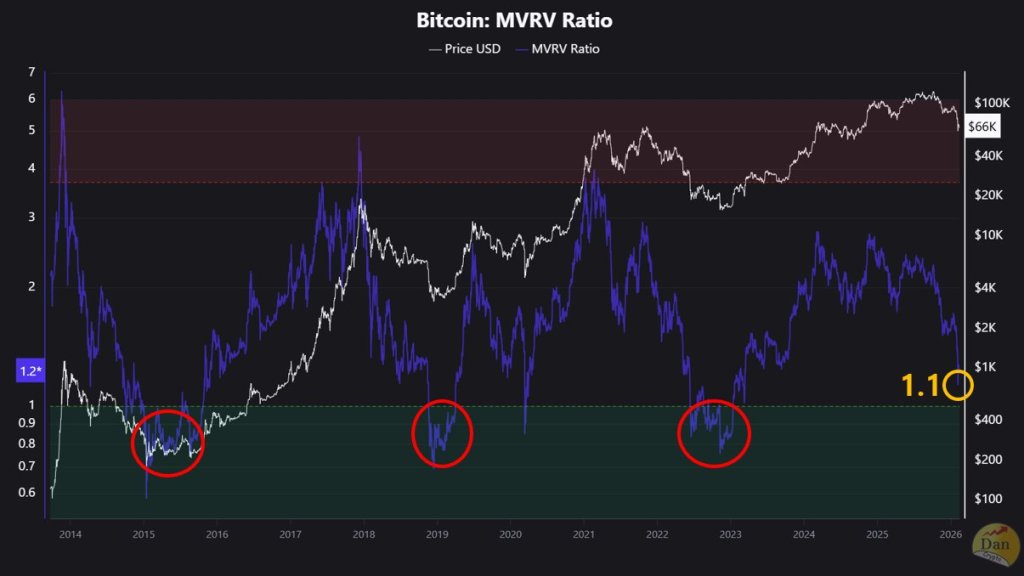
The MVRV framing matters because the metric has tended to compress toward 1 around prior cycle lows. The chart shared alongside the post shows the ratio at roughly 1.10, with earlier sub-1.0 dips highlighted around past bottoming windows.
Crypto Dan cautioned that traders shouldn’t assume the current setup will rhyme perfectly with prior drawdowns, specifically because the preceding advance looked different on valuation measures. “
However, unlike previous cycles, it is necessary to recognize that in this cycle, Bitcoin did not sharply rise all the way into the overvalued zone during the uptrend,” he wrote. “Accordingly, the pattern of the decline may also appear differently from the previous bottom zones, so it seems prudent to prepare for that possibility in our response.”
That caveat became the focal point of a short back-and-forth in replies. One user, onlyus8x, suggested that if Bitcoin reached this cycle’s prior all-time high more than three times faster than before, the downturn could also resolve faster—“might the winter also pass 3 times faster?”
Crypto Dan pushed back on a simple speed analogy, replying: “Because there are differences from your past, I personally set the criteria differently from past decline cycles by comprehensively judging these things as well.”
Mayer Multiple And The 200-Week MA
A separate post from analyst Will Clemente pointed to two long-watched, price-based benchmarks that are also pressing into historically constructive ranges. “Throughout Bitcoin’s life span we have seen two indicators continue to be the best global market bottom signals: The Mayer multiple (distance from 200 day moving average) and the 200 week moving average,” Clemente wrote. “Both of these are clearly in long term accumulation territory.”
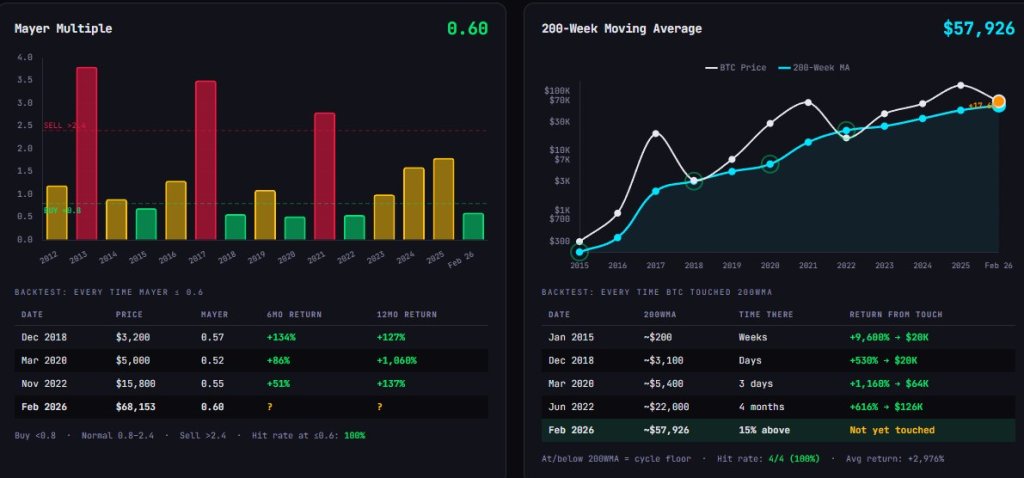
The charts he shared show a Mayer Multiple around 0.60, alongside a backtest table that flags prior instances when the indicator fell to roughly that level. The same image placed Bitcoin’s 200-week moving average near $57,926, with Bitcoin shown about 15% above it and a note that it has “not yet touched” that line in the current drawdown.
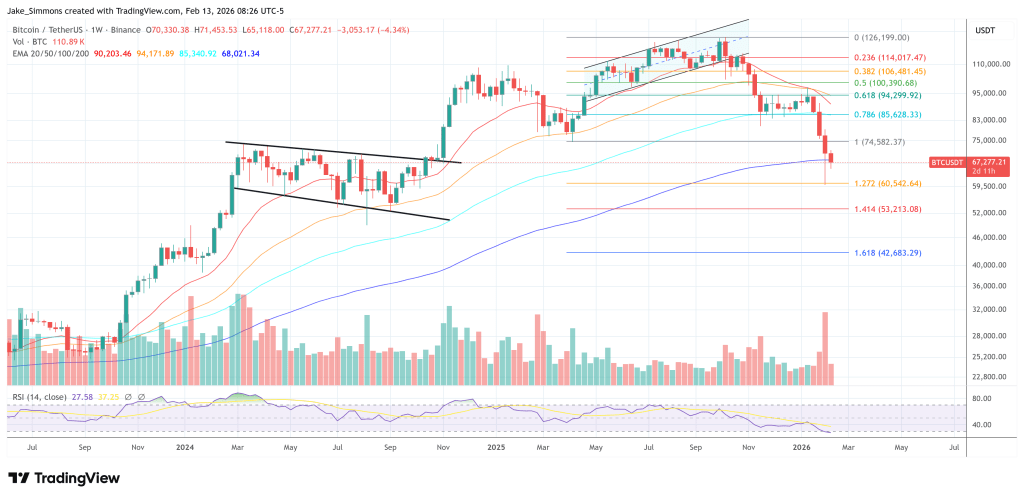
At press time, BTC traded at $67,277.