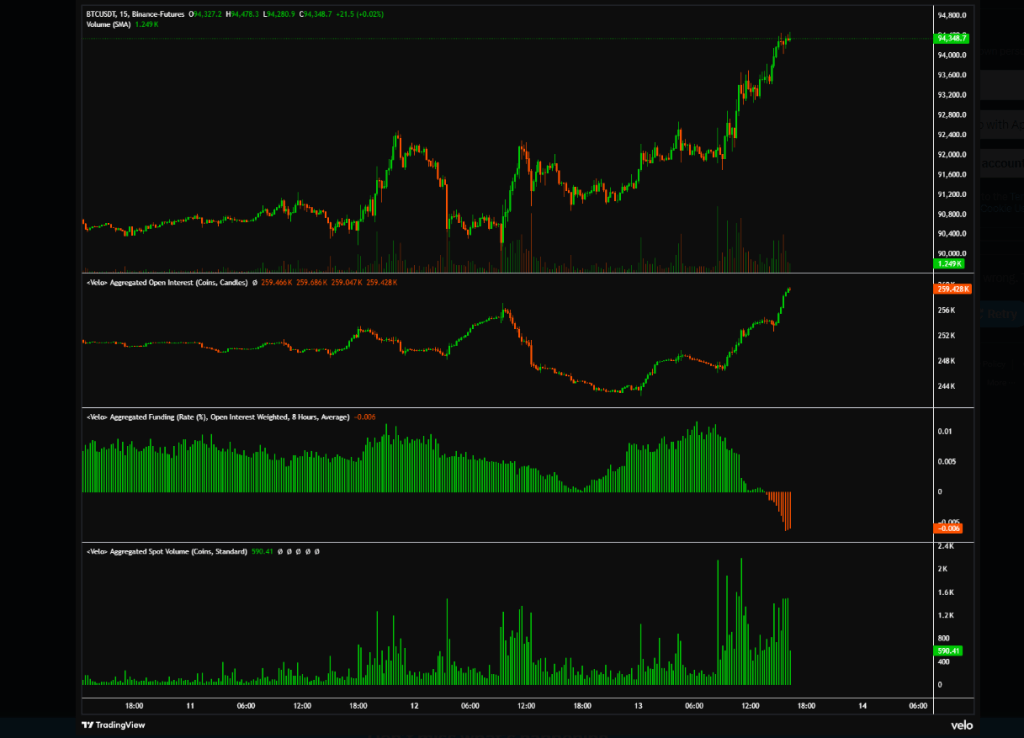
Bitcoin’s price has shown strength over the past 48 hours and is now trading in the mid-$90,000s after days of consolidating around $90,000. Technical analyst Jackis presented a fair assessment of potential paths for Bitcoin’s next significant rise in the context of near-term consolidation and attempted breakouts above $95,000, outlining distinct scenarios for both bulls and bears.
Both Outlooks Have A Case, But Price Has To Confirm
Bitcoin is now back to trading above $95,000 after a 3.1% increase in the past 24 hours. Price action in the past 24 hours alone shows that the outlook might be bullish. However, as it stands, Bitcoin’s price action has reached a point where traders should let the chart tell them what’s next.
According to a technical analysis from a crypto analyst known as Jackis on the social media platform X, arguments alone are not enough here because there are both good bullish & bearish arguments out there for Bitcoin. In his words , he has watched similar-looking price action resolve in opposite directions across different cycles.

The chart below shows how Bitcoin price action is currently forming an ascending triangle pattern on the 8-hour candlestick timeframe chart. However, examples show how this same formation led to an upward reversal for Bitcoin in the past and then also a bearish continuation for Ethereum in the past.
Based on his read, he currently sees more reasons for downward continuation, and until the market proves otherwise, the active trend is bearish. Both bullish and bearish outlooks have a case, but price action has to confirm.
Bullish And Bearish Scenarios For Bitcoin
Once price breaks out in either direction, the follow-through can be fast, which means being stubborn on the wrong side can be costly.
On the bullish side, Jackis highlighted that a breakout toward $96,000 is the kind of move that would confirm a bullish continuation. He added that a push through $96,000 at this point could open the path to $107,000 or higher.
On the other hand, Jackis’ bearish trigger is tied to the rising support line. Price action can look constructive right up until the trendline snaps, and that’s the point where downside continuation becomes the higher-probability route in this framework.
If Bitcoin were to lose the lower trendline of the ascending trend, then it would likely drift back to the April 24 lows. The April lows refer to how Bitcoin rejected above $106,100 in January 2025 and entered into a multi-month correction that eventually bottomed at a low around $76,000.
This means that a clean breakdown could change the conversation away from range chop in the mid-$90,000s to a reset.