The post 29% of Bitcoin Supply Is Underwater—Warning Sign or the Start of a New BTC Bull Run? appeared first on Coinpedia Fintech News
Bitcoin (BTC) price has entered November on a cautious note, trading around $103,000 after failing to reclaim the $112,000 mark set earlier in October. The broader crypto market is mirroring Bitcoin’s slowdown, with major altcoins showing limited movement as traders digest macro cues and ETF flow data. Moreover, the price marking an intraday low below the psychological barrier at $100,000 has made investors more pessimistic.
Despite the cooling momentum, on-chain metrics suggest a very different story beneath the surface—one that echoes the early stages of every historic Bitcoin rally. Analysts are calling it the $6 trillion endgame—a confluence of supply compression, leverage reset, and liquidity expansion that could mark the start of Bitcoin’s next parabolic leg.
The Hidden Signal: 29% of Bitcoin Supply Underwater
Since Bitcoin’s price surpassed $100,000, investors and market participants expected the token to test higher targets ranging from $150,000 to $200,000. The trading volume has doubled since the Q4 2024 breakout, hinting towards strong buying. Now that the bulls are losing their grip on the rally, these investors are incurring losses. Hence, Bitcoin’s circulating supply is currently held at a loss. However, it could be a massive bullish signal, as a similar technical has led the rally to new highs previously.
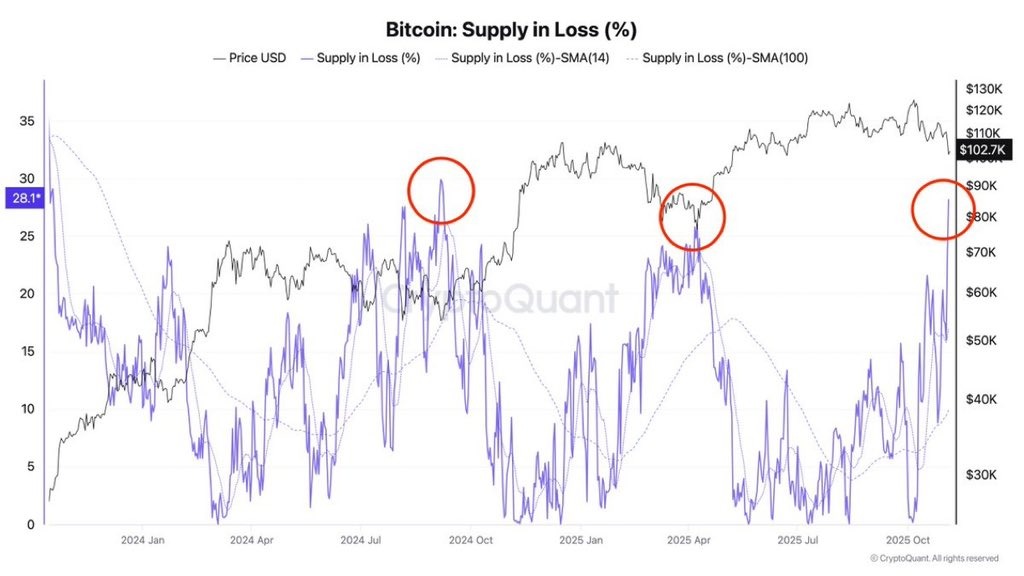
The above chart shows roughly 29.2% of Bitcoin’s circulating supply is now being held at a loss—a figure that’s appeared only three times in the past decade.
Each prior instance preceded explosive rallies:
- May 2017 → BTC rallied from $1,800 to $19,800
- May 2021 → from $30,000 to $69,000
- March 2024 → from $40,000 to $73,000
In all cases, the majority of market participants called for deeper corrections—and all were wrong. This recurring pattern suggests that a high percentage of “coins in loss” actually signals capitulation exhaustion, not collapse.
Leverage Flush: Market Structure Resets
In the past few days, nearly $30 billion in leveraged positions was wiped out. Perpetual open interest dropped by 42%, from the highs of over $90 billion to $68.6 billion—its sharpest decline this year.
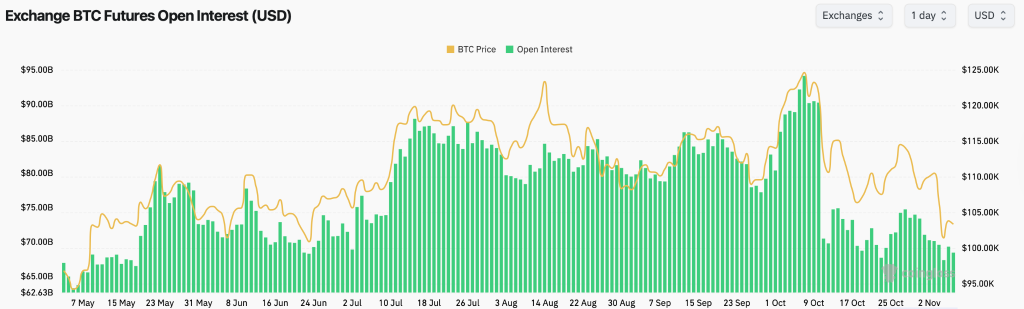
Funding rates have reset to near 0.01%, signalling a neutral derivatives market. That means no more overcrowded longs, no cascade risk, and no forced sellers. Historically, when leverage purges while spot demand builds, the market doesn’t collapse—it reloads. The structure is now clean for directional moves, with derivative positioning at its lowest level in months.
What’s Next—Will Bitcoin (BTC) Price Rebound to $110,000?
The Bitcoin price underwent massive selling pressure at the start of the month, dragging the levels below the threshold at $100,000. Although the bulls helped the rally recover above the range, the upward pressure continues to prevail. Currently, the price is facing equal pressure on both sides, which raises concerns over the upcoming price action.

Since the start of the final quarter, liquidity has been flowing out of the crypto, probably to other altcoins. The on-balance volume has been plunging constantly since the start of October. The trend appears to be replicating the downfall from February to March that dragged the price from over $106K to $77K. On the other hand, the Chaikin money flow displays a bearish divergence, despite being within the negative range. These indicators suggest the BTC price may lose ground soon and drop back below $100K.
Presently, there are two important support levels for Bitcoin, one at $100,618 and one at $98,139, that are expected to be tested soon. The technicals are plunging and may continue to do so for some more time; hence, the price is compelled to drag the levels below $100K.