Ethereum price started a fresh decline below $3,500. ETH is attempting to recover from $3,050 but faces resistance near $3,500.
- Ethereum started another bearish wave after it settled below $3,550.
- The price is trading below $3,500 and the 100-hourly Simple Moving Average.
- There was a break above a bearish trend line with resistance at $3,410 on the hourly chart of ETH/USD (data feed via Kraken).
- The pair could continue to move down if it trades below $3,320.
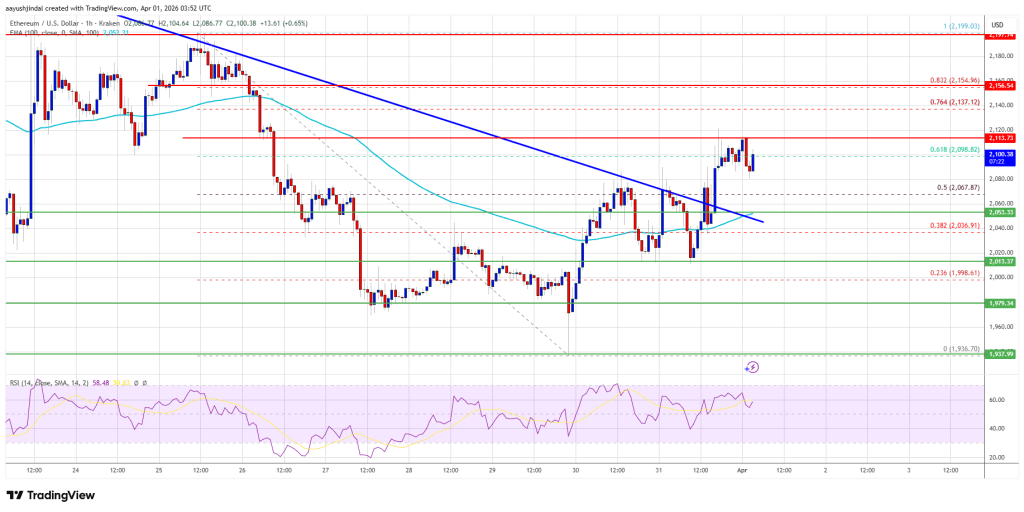
Ethereum Price Faces Resistance
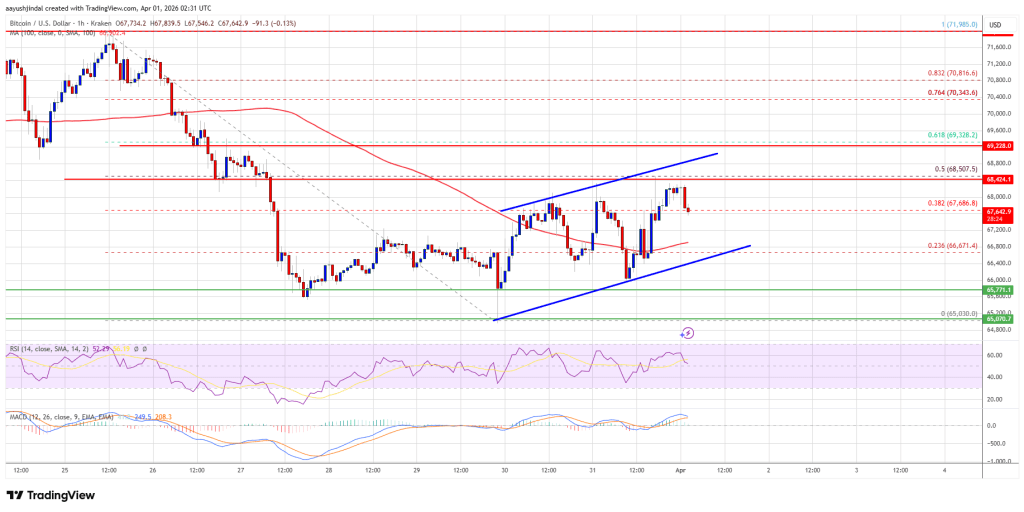
Ethereum price failed to stay in a positive zone and started a fresh decline below $3,500, like Bitcoin . ETH price declined below $3,450 and $3,350 to enter a bearish zone.
The decline gained pace below $3,250. Finally, the bulls appeared near $3,050. A low was formed at $3,058 and the price recently started a recovery wave. There was a move above the 23.6% Fib retracement level of the downward move from the $3,920 swing high to the $3,058 low.
Besides, there was a break above a bearish trend line with resistance at $3,410 on the hourly chart of ETH/USD. However, the bears remained active below $3,500 and the 50% Fib retracement level of the downward move from the $3,920 swing high to the $3,058 low.
Ethereum price is now trading below $3,400 and the 100-hourly Simple Moving Average. If there is another recovery wave, the price could face resistance near the $3,450 level. The next key resistance is near the $3,480 level.
The first major resistance is near the $3,500 level. A clear move above the $3,500 resistance might send the price toward the $3,550 resistance. An upside break above the $3,550 region might call for more gains in the coming days. In the stated case, Ether could rise toward the $3,740 resistance zone or even $3,800 in the near term.
Another Decline In ETH?
If Ethereum fails to clear the $3,480 resistance, it could start a fresh decline. Initial support on the downside is near the $3,320 level. The first major support sits near the $3,260 zone.
A clear move below the $3,260 support might push the price toward the $3,150 support. Any more losses might send the price toward the $3,050 region in the near term. The next key support sits at $3,020 and $3,000.
Technical Indicators
Hourly MACD – The MACD for ETH/USD is losing momentum in the bearish zone.
Hourly RSI – The RSI for ETH/USD is now above the 50 zone.
Major Support Level – $3,260
Major Resistance Level – $3,500