CryptoQuant Head Reveals Reason Behind Bearish Bitcoin Trend


CryptoQuant’s research head has pointed out how demand to absorb Bitcoin at higher prices has been low recently, potentially explaining the asset’s decline.
Bitcoin Apparent Demand Metric Has Turned Red Recently
In a new post on X, Julio Moreno, head of research at on-chain analytics firm CryptoQuant, has looked at recent BTC market dynamics from a different angle. “Instead of looking at Bitcoin long-term holder distribution/spending, I like to look at the other side of the trade,” noted Moreno.
Long-term holders here refer to the BTC investors who have been holding onto their coins for a period longer than 155 days. This cohort is considered to include the high-conviction “HODLers” of the market, so distribution from them is often something on-chain analysts watch out for.
As CryptoQuant community analyst Maartunn has highlighted in a separate X post , Bitcoin long-term holders have participated in a significant amount of selling during the past month.
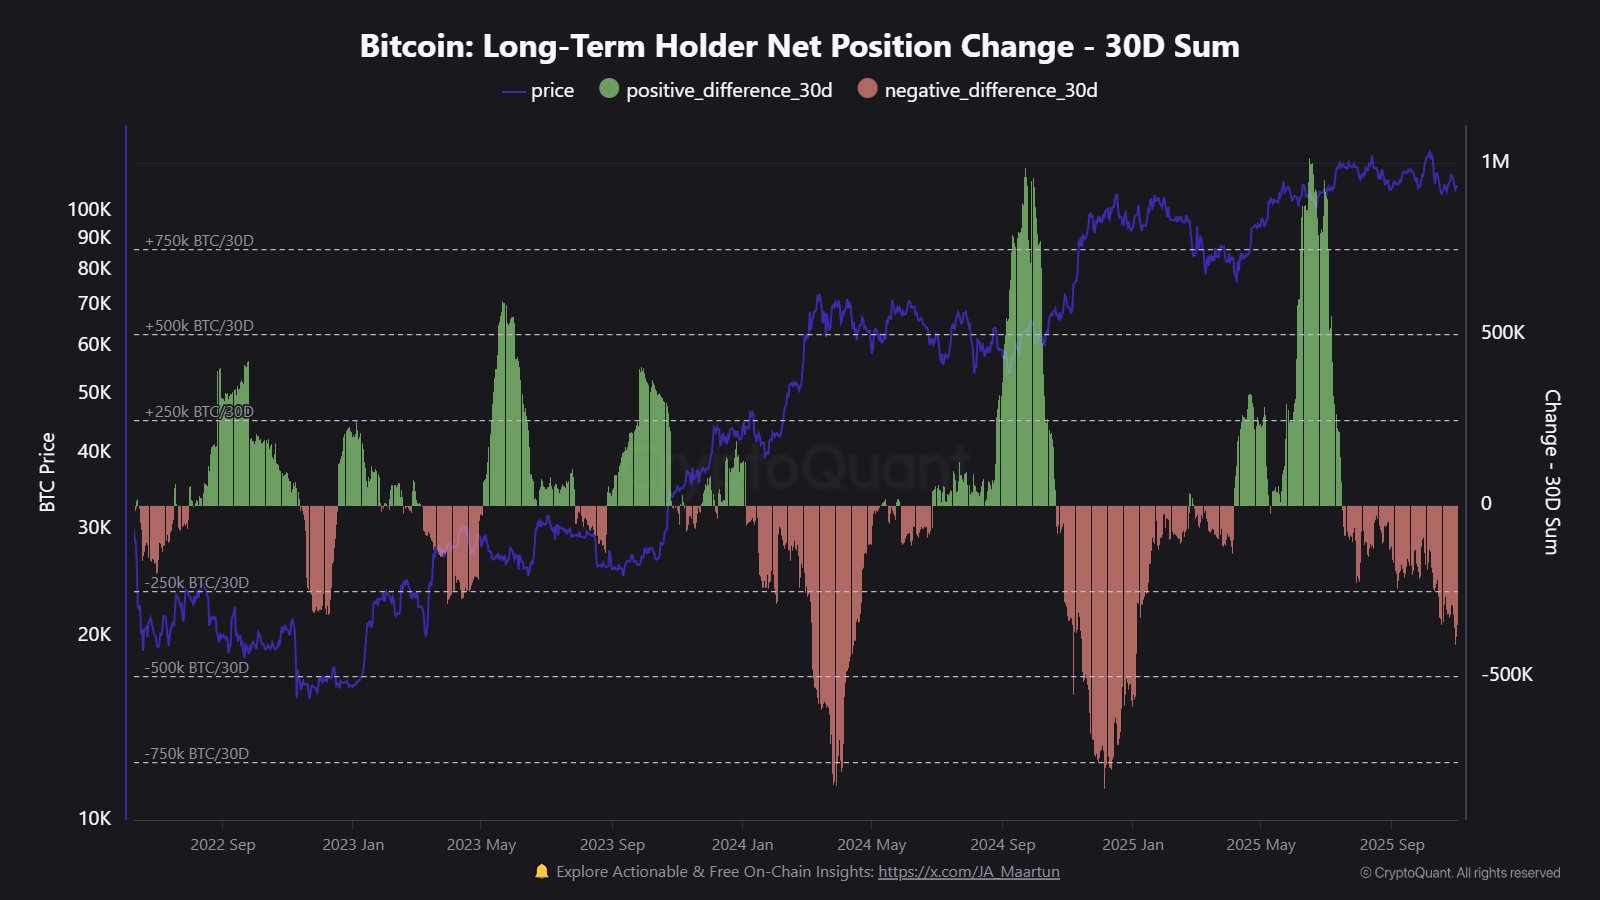
This isn’t the signal Moreno focuses on, however. Instead, the CryptoQuant head checks for whether there is enough demand coming in to absorb the supply that the long-term holders are selling at higher prices.
An indicator that can be useful for tracking this is the Apparent Demand , which compares the difference between BTC’s production and changes in its long-term inventory. “Production” is the amount that miners are issuing on the network every day, while the “inventory” is the supply that has been inactive for over a year.
Now, here is the chart shared by Moreno that shows the trend in the 30-day and 1-year versions of the Bitcoin Apparent Demand over the last few years:

As displayed in the above graph, the Bitcoin Apparent Demand has been red on the 30-day during the last few weeks, implying a negative short-term demand for the cryptocurrency. “Is there enough demand to absorb the supply at higher prices?” asked the analyst. “Since a few weeks ago the answer is no, and that is why we see prices declining.”
The story is a bit different when it comes to the 1-year Apparent Demand, which has actually seen some growth recently, but the pace of its rise has been slow, and its value is still below the 90-day simple moving average (SMA).
The last time Bitcoin saw an extended phase of negative 30-day Apparent Demand was during the bearish phase in the first half of the year. It now remains to be seen whether something similar will follow this time as well, or if demand will bounce back.
BTC Price
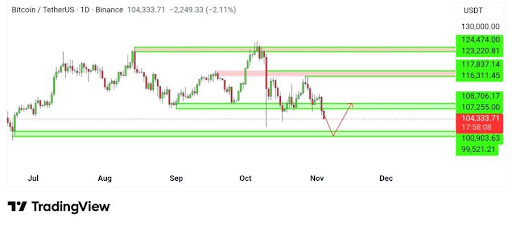
At the time of writing, Bitcoin is floating around $103,900, down 9% over the last seven days.

Crypto Isn’t Topping Yet: Arthur Hayes Says Stealth QE Is Near
Arthur Hayes argues that the next leg of the crypto cycle will be driven not by a headline pivot to ...
Bitcoin Bears Press On — Is $102,000 Flush The Final Washout Before A Rally?
Bitcoin’s price continues to face mounting pressure as it hovers near key support levels. With selle...
Analyst’s Full Market Breakdown Shows Why Bitcoin Price Is Headed For $120,000
Bitcoin might be currently trending downwards, but a full fundamental breakdown shows it is ready to...