XRP Price Stays Weak — Bearish Outlook Intact Under $2.60 Resistance


XRP price started a fresh decline from $2.550. The price is now showing bearish signs and is at risk of another decline in the near term.
- XRP price failed to continue higher above $2.550 and corrected some gains.
- The price is now trading below $2.50 and the 100-hourly Simple Moving Average.
- There is a bearish trend line forming with resistance at $2.580 on the hourly chart of the XRP/USD pair (data source from Kraken).
- The pair could start a fresh increase if it stays above $2.410.
XRP Price Dips Again
XRP price formed a short-term top near $2.550 and started a downside correction, like Bitcoin and Ethereum . The price dipped below the $2.520 and $2.50 levels.
There was a move below the 50% Fib retracement level of the upward wave from the $2.377 swing low to the $2.552 high. The price even spiked below $2.42 but remained stable above $2.40. Besides, there is a bearish trend line forming with resistance at $2.580 on the hourly chart of the XRP/USD pair.
The price is now trading below $2.50 and the 100-hourly Simple Moving Average. If there is a fresh upward move, the price might face resistance near the $2.480 level. The first major resistance is near the $2.50 level, above which the price could rise and test $2.550.
A clear move above the $2.550 resistance might send the price toward the $2.580 resistance and the trend line. Any more gains might send the price toward the $2.650 resistance. The next major hurdle for the bulls might be near $2.720.
More Losses?
If XRP fails to clear the $2.580 resistance zone, it could start a fresh decline. Initial support on the downside is near the $2.410 level and the 76.4% Fib retracement level of the upward wave from the $2.377 swing low to the $2.552 high. The next major support is near the $2.380 level.
If there is a downside break and a close below the $2.380 level, the price might continue to decline toward $2.320. The next major support sits near the $2.250 zone, below which the price could continue lower toward $2.20.
Technical Indicators
Hourly MACD – The MACD for XRP/USD is now gaining pace in the bearish zone.
Hourly RSI (Relative Strength Index) – The RSI for XRP/USD is now below the 50 level.
Major Support Levels – $2.410 and $2.380.
Major Resistance Levels – $2.550 and $2.580.
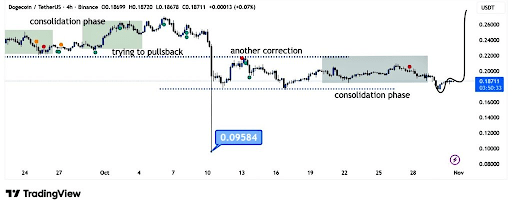
Here’s What Happens To The Dogecoin Price After The Consolidation Phase Ends
Dogecoin has spent the past several days locked in a tight decline that has seen it push lower. The ...
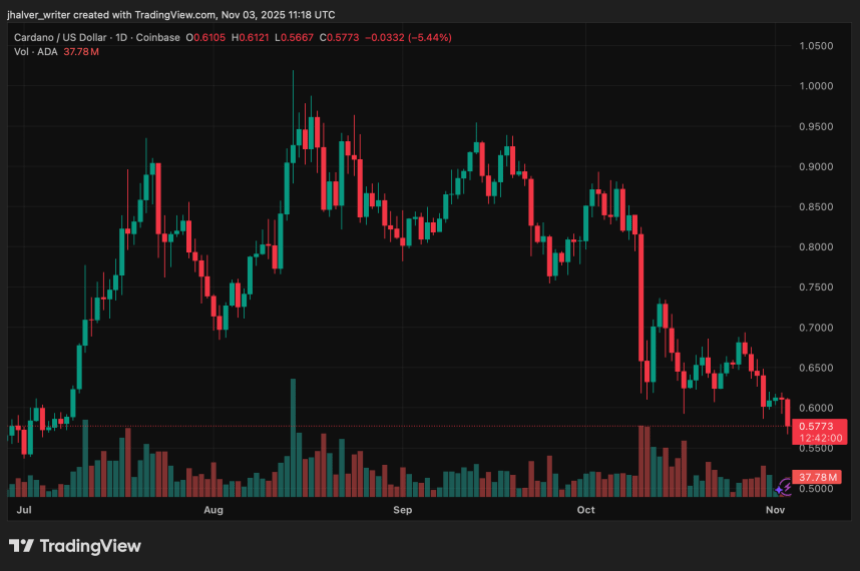
Cardano (ADA) Price Drops 5% Amid Trader Shorts, Hoskinson Blames Community for DeFi Struggles
Cardano (ADA) continued its downward slide on Monday, falling over 5% to trade around $0.57, extendi...
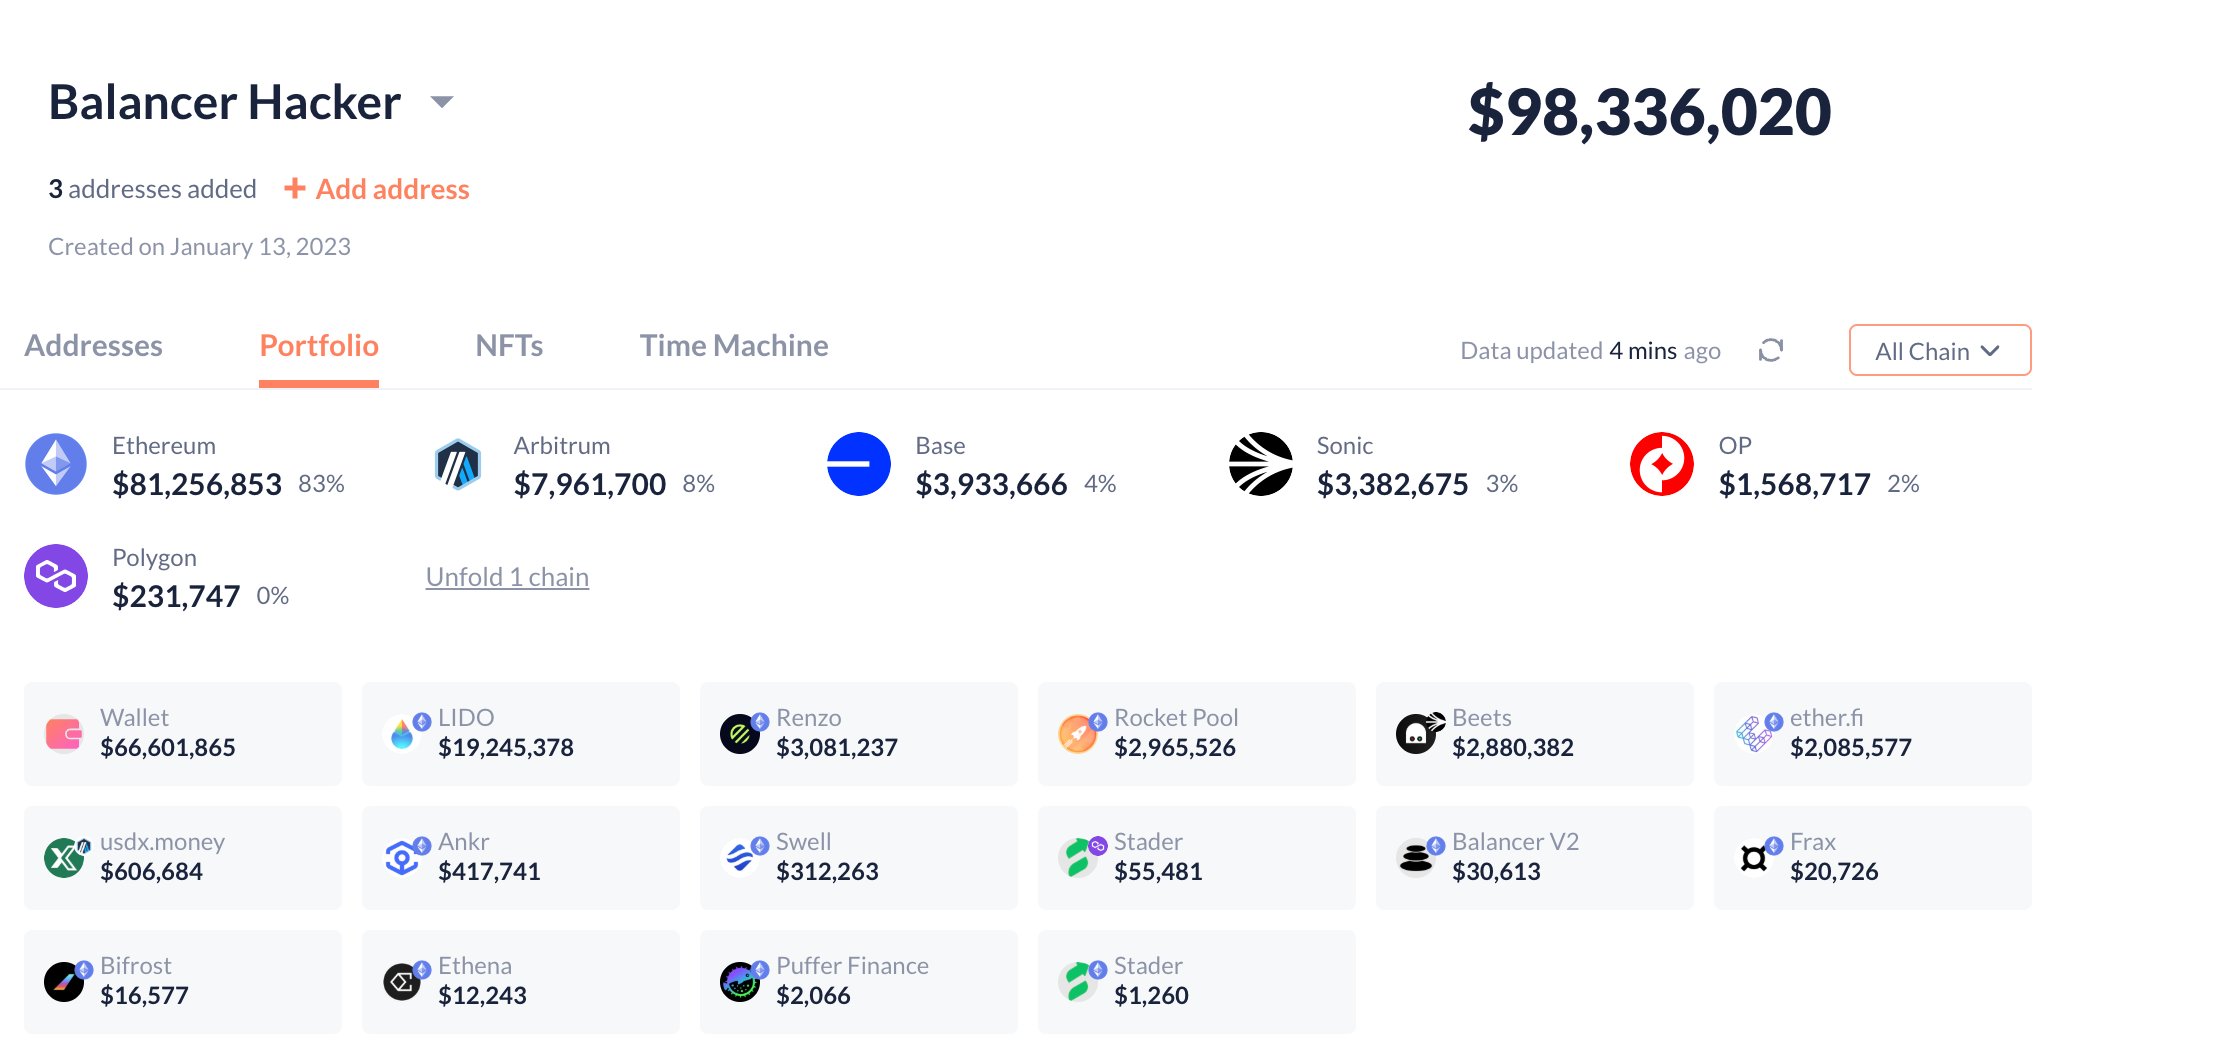
Balancer Protocol Sees $70M Exit In Suspected Crypto Exploit
Balancer, one of the most established decentralized finance (DeFi) protocols with more than $700 mil...