Bitcoin At Key Retest: Bounce Or $98,000 Next?


On-chain data shows Bitcoin is currently retesting a historically significant level that has often decided the course of the cryptocurrency’s price.
Bitcoin Is Retesting The 0.85 Supply Quantile
In a new post on X, on-chain analytics firm Glassnode has talked about how Bitcoin is retesting a level that has historically been a “make-or-break” one for the asset.
The level in question is part of Glassnode’s “ Supply Quantiles Cost Basis Model .” The model reflects price levels corresponding to important investor profitability thresholds.
Below is the chart shared by the analytics firm that shows how the levels of this model have changed over the last few years.

As is visible in the graph, Bitcoin surged above the 0.95 quantile during the recent rally to the all-time high (ATH). This level corresponds to 95% of the supply being in profit.
With the market downturn that has followed since, however, the cryptocurrency has slipped under the level. Recently, the asset has been making retests of the 0.85 quantile, situated at $109,000.
BTC has already seen brief drops below this mark, but so far, it has managed to climb back above it each time. At present, the coin is trading right around the level, indicating that about 85% of the supply is carrying a net unrealized gain.
In the past, Bitcoin’s interactions with this level have tended to carry consequences for its trajectory. “Holding it has sparked major rallies, but losing it often sees a slide toward the 0.75 band,” noted Glassnode.
The 0.75 quantile is equivalent to $98,000 at the moment. It now remains to be seen whether BTC can hold above the 0.85 quantile, or if a retrace to this level is coming.
In some other news, the latest decline in Bitcoin below $107,000 came alongside negative values on the Coinbase Premium Gap , as pointed out by CryptoQuant community analyst Maartunn in an X post .
The Coinbase Premium Gap measures the difference between the Bitcoin price listed on Coinbase (USD pair) and that on Binance (USDT pair). The metric basically tells us about how the behavior of the users on the former exchange differ from that of the latter platform.
As the below chart shows, the metric was at positive levels on Wednesday, but the indicator turned red on Thursday.

The trend would imply that Coinbase traders, primarily made up of American institutional entities , sold the cryptocurrency at a higher intensity than Binance’s global whales during the Bitcoin drawdown.
BTC Price
Since the wave of selling on Coinbase, Bitcoin has witnessed some recovery back to the $109,500 level, reclaiming the 0.85 quantile once again.


Dogecoin Enters The Big Leagues — Stadium And Jerseys Get A Crypto Makeover
According to company releases and club statements, House of Doge and Brag House Holdings, Inc. have ...
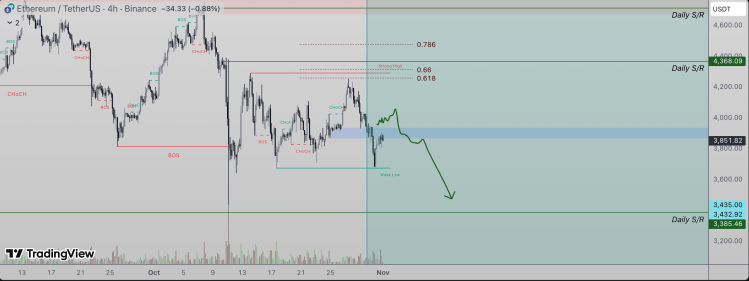
Ethereum Price Could Crash Below $3,400 After Rejection From 0.618 Fibonacci Level
The recent Ethereum price rejection that pushed it back below the $4,000 level has created a concern...
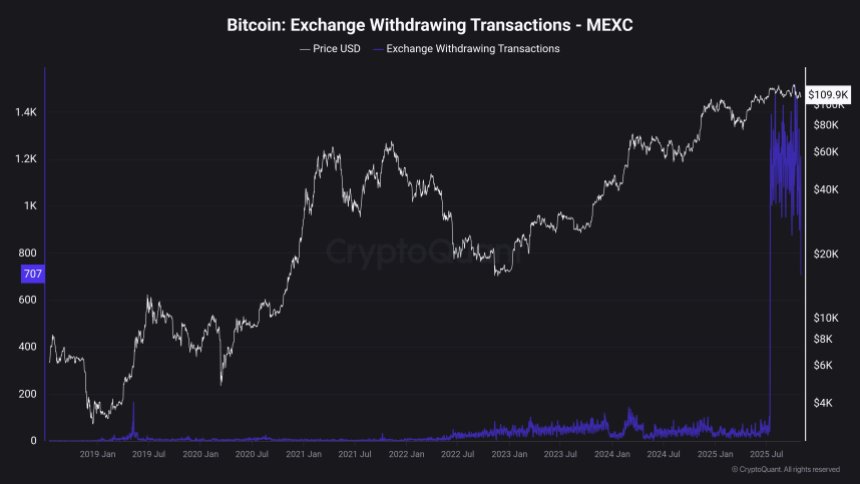
Behind The MEXC Drama: Is Bankruptcy Inevitable?
Seychelles-based cryptocurrency exchange MEXC found itself in the midst of controversy on Friday as ...