Dogecoin’s daily time-frame has reached a critical point that leaves virtually no margin for error. Price settled last night at $0.17551, clinging to a slender cushion just above the confluence of two of the chart’s most important guide rails: the former down-trend resistance that runs from late February and the 78.6 percent Fibonacci retracement of 2024’s late advance to $0.48440.
Dogecoin Enters Danger Zone
The structural landscape is defined by a six-month descending channel that has corralled every impulse since Dogecoin topped at $0.48440 on 8 December. The median of that channel—slicing through the field at roughly $0.1800—functioned as durable support until Thursday, when an 11% slide in sympathy with Bitcoin split it cleanly. A failure-retest of a channel mid-line is seldom trivial; until DOGE can reclaim $0.1800 on a closing basis, the chart message remains one of trend continuity.
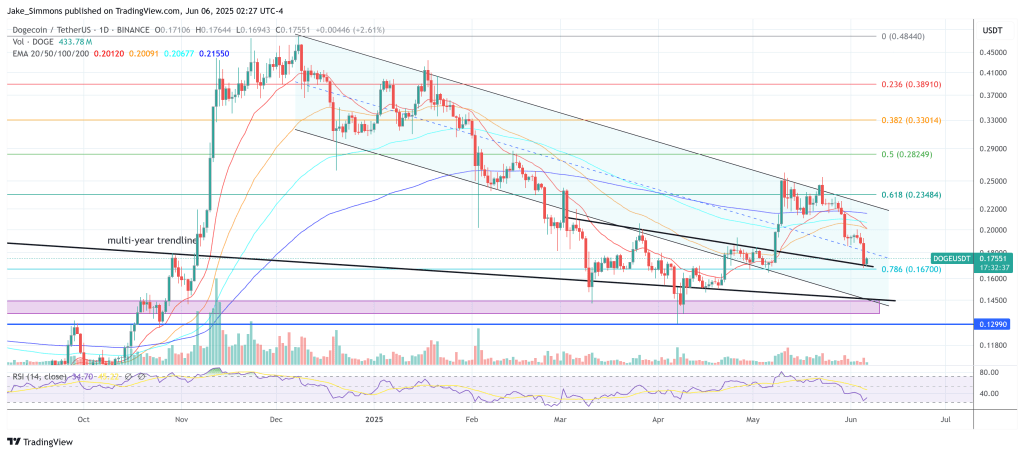
Beneath the market, the black trendline that first rejected rallies on 26 March, 26 April and 2 May reclaimed centre-stage after price vaulted it on 8 May, ran to the channel ceiling at $0.2540, and was twice rebuffed—the first rejection on 11 May, the second on 23 May. The trendline is now retested as support where it intersects the 0.786 Fib at $0.16700, producing a high-stakes cross-point.
If that level fractures, the only historical scaffolding is the multi-year ascending trendline (drawn from May 2021’s all-time high) that merges with a proven demand band spanning $0.14500 to $0.13500. That rectangle arrested the early-April shake-out and would represent the bulls’ final trench; surrendering it would invalidate the long-term series of higher lows and almost certainly inaugurate a broader bear phase with potential gravitational pull back to the January pivot at $0.12990.
Oscillators and overlays do little to contradict the bearish drift. The fourteen-day Relative Strength Index sits at 34.70, hovering just above oversold territory but still tracking below its own moving average at 45.22, underscoring persistent negative momentum.
Price Targets
Overhead, resistance layers are stacked like dominoes. Immediate priority for the bulls is a daily close back above the channel midline at $0.1800; failing that, any attempt at recovery is suspect.
The next ceiling is the compressing exponential moving average cluster: the 20-day EMA at $0.20120, the 50-day at $0.20091, the 100-day at $0.20677 and the 200-day at $0.21550. With all four averages declining and bunched inside a three-cent band, they act as a single reinforced lid near the psychological $0.20 handle.
Clearing that barricade would deliver price to the channel’s upper rail, now descending through $0.22. A weekly close outside that boundary would finally neutralise the half-year downtrend and force shorts to cover into the next Fibonacci checkpoints derived from the November high: the 61.8 percent retracement at $0.23484, the 50 percent at $0.28249, the 38.2 percent at $0.33014 and the 23.6 percent at $0.38910.
Until then, however, the blunt arithmetic favours the bears. A floor at $0.16700 backed by a multi-touch trendline is slim protection when sentiment is fragile and macro flows are unhelpful. If that shelf cracks, the market’s inertia points toward $0.14500–$0.13500, Dogecoin’s last defensible plateau.
Should that red demand zone capitulate, the technical map turns blank down to the January base at $0.12990 and, beyond that into deep bearish territory, especially the August 2024 low at $0.08.