比特币行情软件SierraChart使用教程

Favorite
Share
Scan with WeChat
Share with Friends or Moments
1、首先下载软件:
http://www.sierrachart.com/downloads/SierraChartSetup.exe
http://mining.bitcoin.cz/media/download/sierrachartfeed-0.5.exe
2、安装第一个,一路next,打开后需要账户,到下面这个地址去创建账户:
https://www.sierrachart.com/RegisterStep1.php
完了之后,就等待该网站给你开放账户。
账户会有个试用期,不过没关系,过了试用期也一样用,我们也就用这软件看看图形。
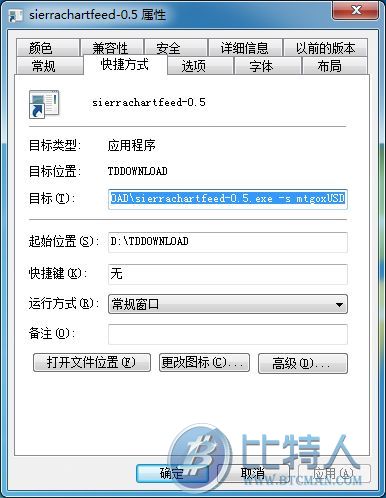
3、在桌面上创建一个快捷方式指向下载好的sierrachartfeed-0.5exe,然后右键快捷方式—>属性,在目标栏中后面加上 –s mtgoxUSD,如下图:
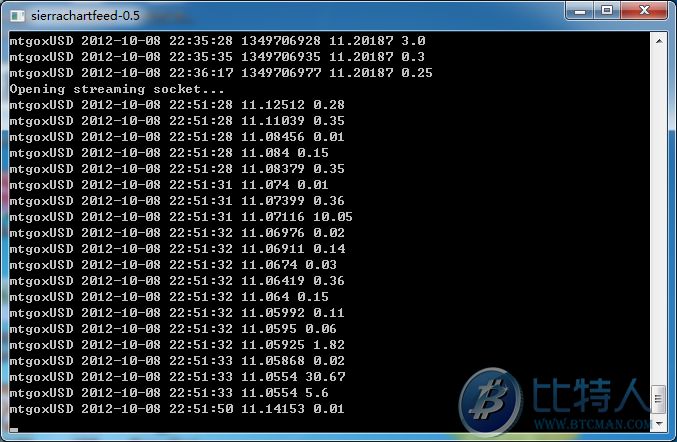
确定即可,就会开始下载数据,大概100多M,要等一等,如下图:
4、等数据下载完毕后,打开Sierra Chart (C--SierraChart)软件,登录
FileàNew/Open Intraday Chart
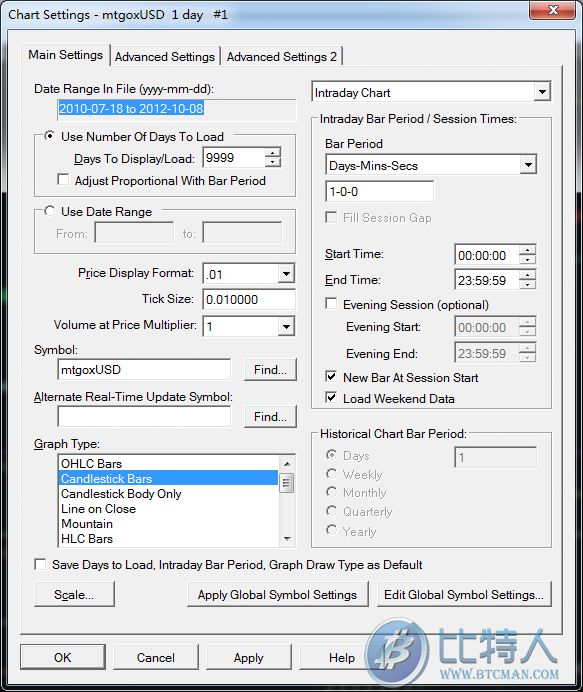
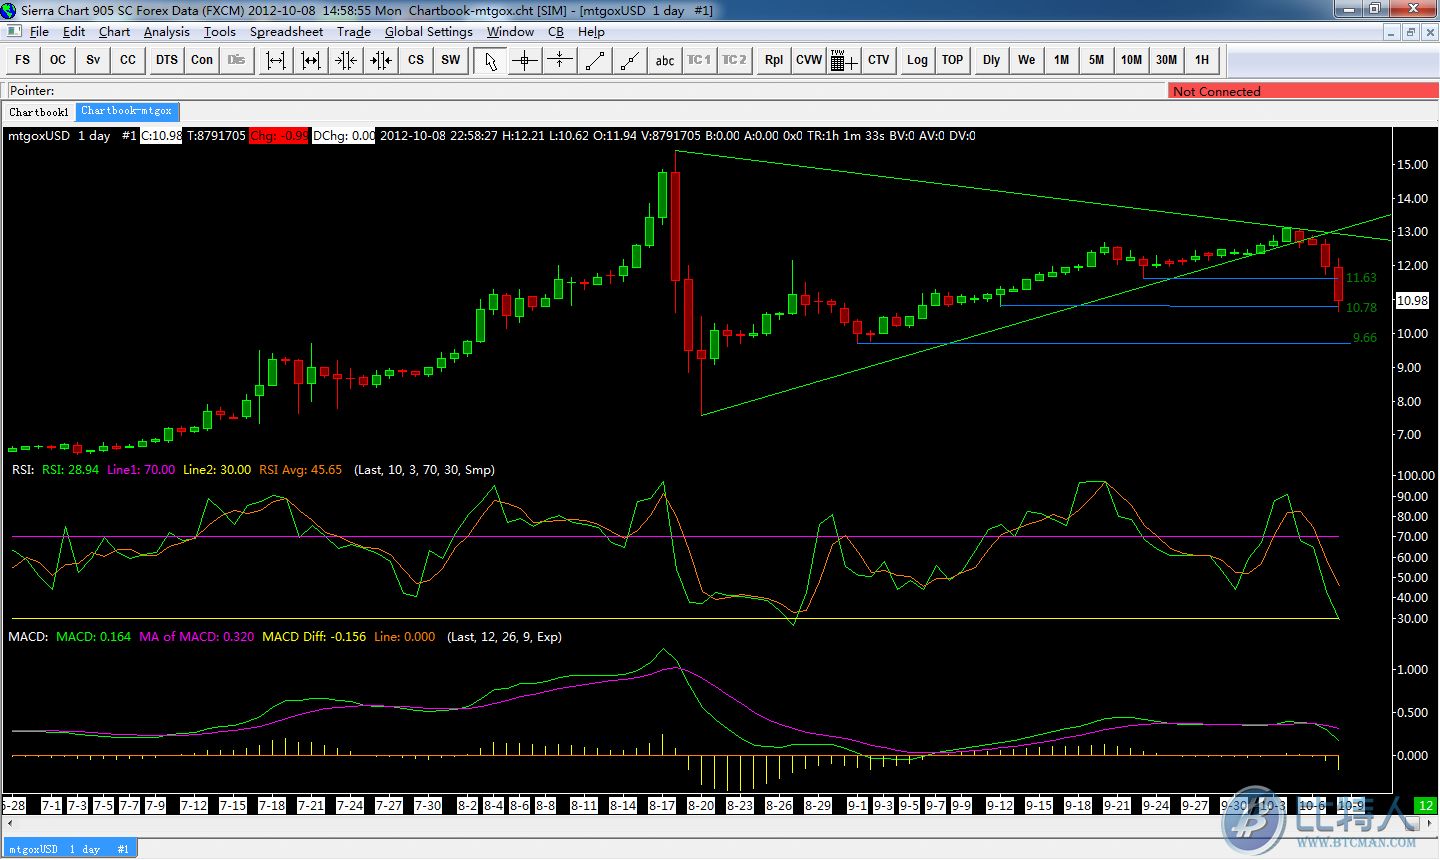
选择mtgoUSD.scid,就会显示出图形了。但这个图形不好看,我们还要做一些设置,
在图形上点击右键àChart settings,然后把各项设置调整成下面这个图的设置就好:
这样你就能看蜡烛图了。
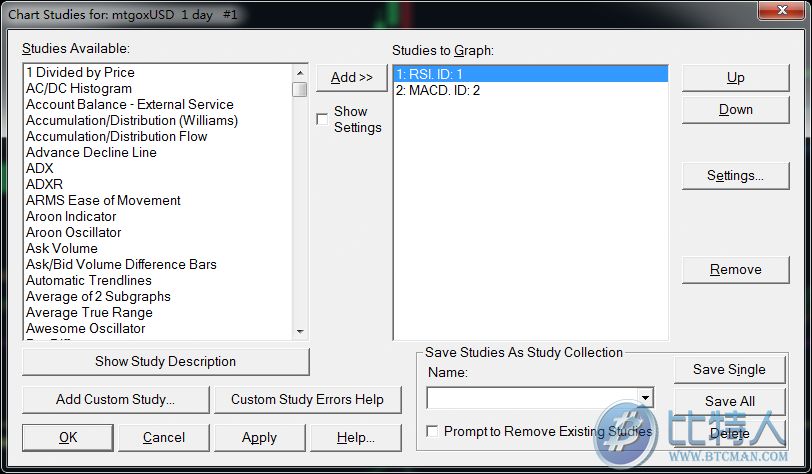
在图形右键的Studies属性中,可以添加各种技术指标,我这里是添加了RSI和MACD指标:
好了,现在可以正常使用了。
|
|
Disclaimer: This article is copyrighted by the original author and does not represent MyToken’s views and positions. If you have any questions regarding content or copyright, please contact us.(www.mytokencap.com)contact
About MyToken:https://www.mytokencap.com/aboutusArticle Link:https://www.mytokencap.com/news/168397
Previous:怎样导出PTS钱包私钥?
Related Reading

Historical Data Predicts Dogecoin Price Crash In August — But There’s A Silver Lining
The month of August has historically been very bearish for the Dogecoin price, and with the new mont...
Crypto Hacks Surge 27% In July: $142M Stolen As 2025 Trend Continues
As the market soared in July, crypto hacks also saw a significant increase from the previous month, ...
Mill City Ventures Secures $500M Equity Line to Bolster SUI Treasury Strategy
Mill City secures $500M equity line to expand its SUI treasury, with matched $SUI tokens from the Su...