



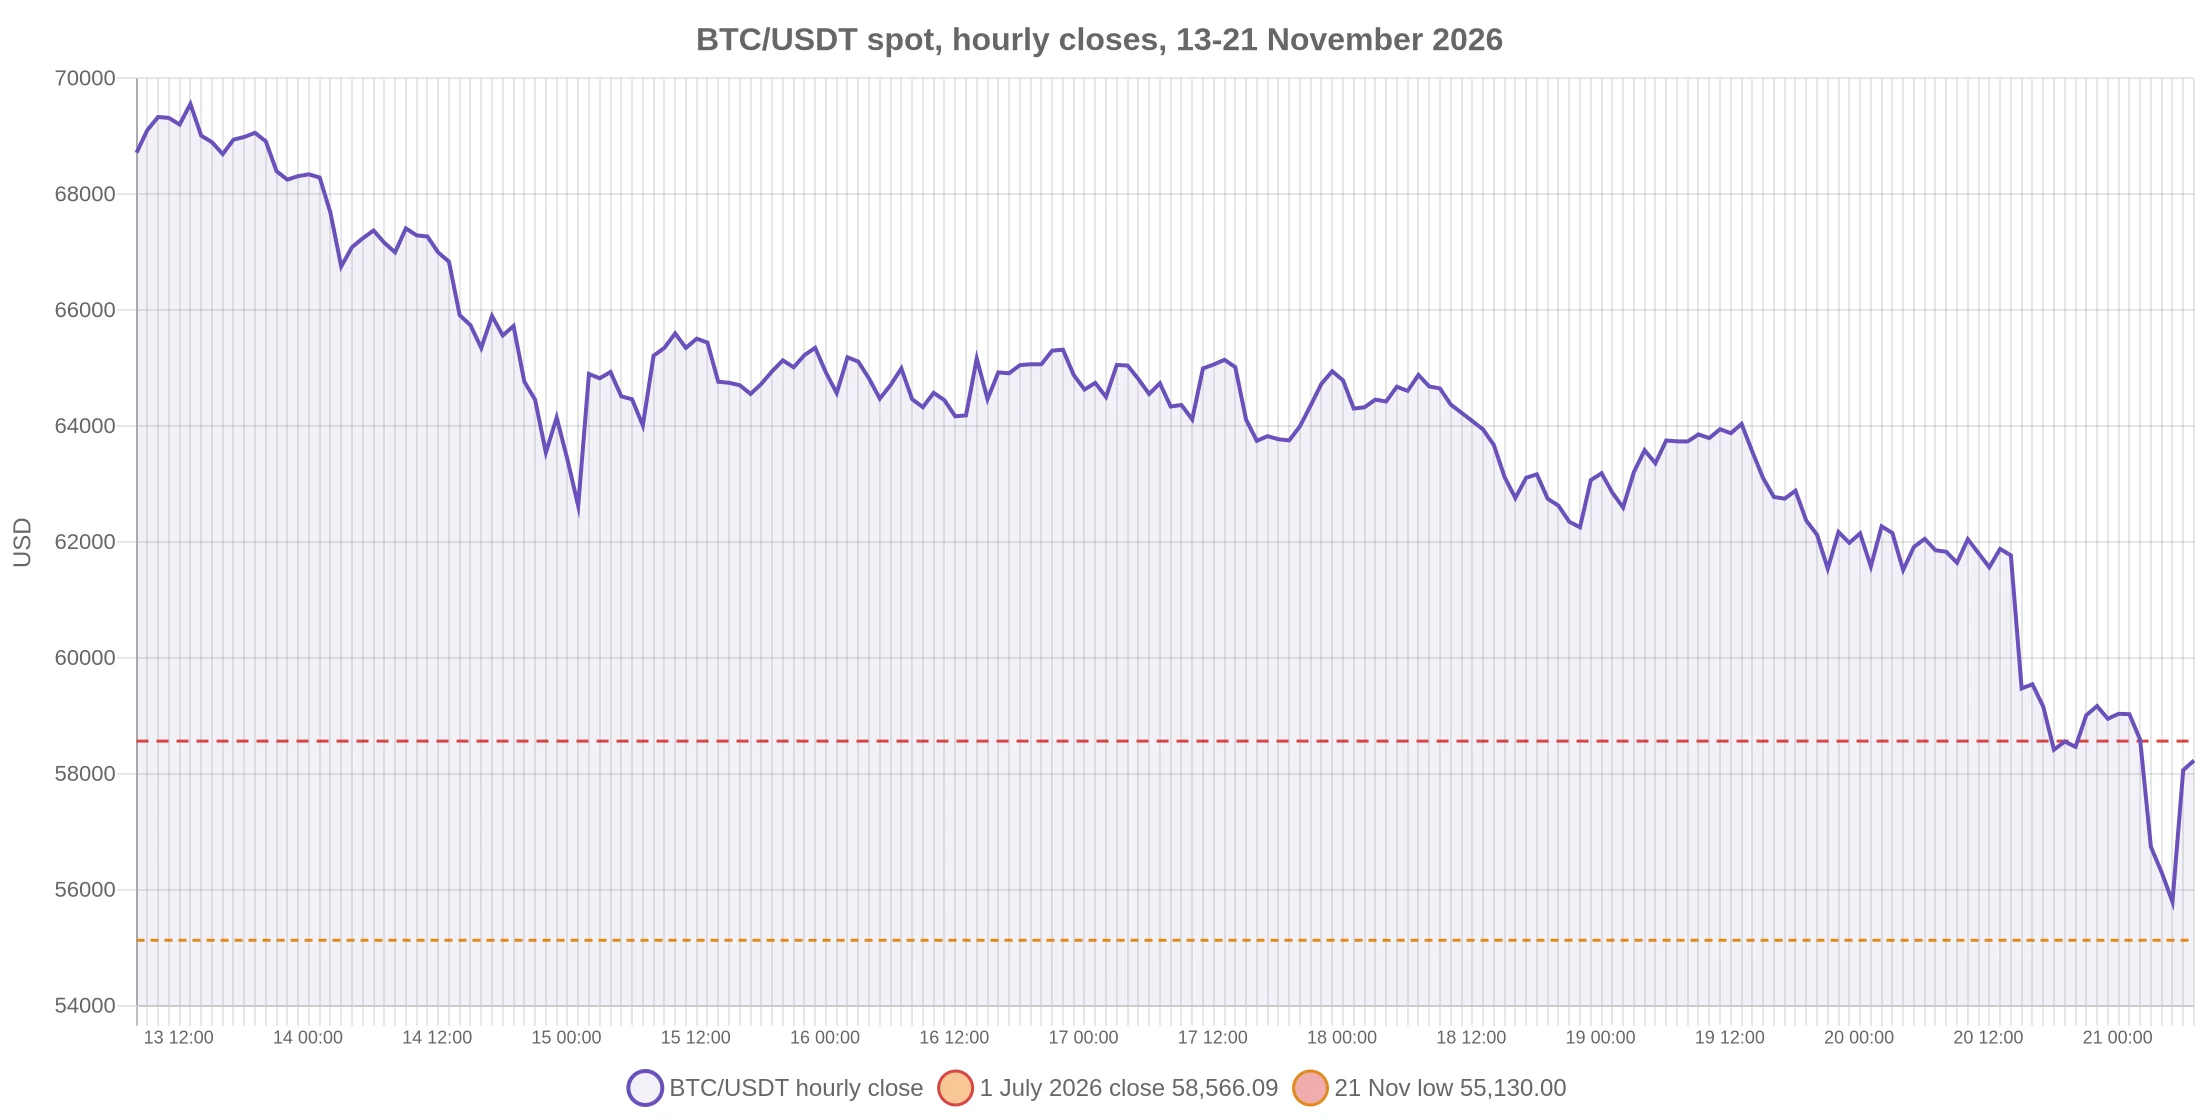
Bitcoin is trading at $58,136, down 5.72% in 24 hours, after Binance’s BTC/USDT spot pair flushed to $55,130.00 in the 06:00 UTC hour on Saturday and closed that same hour at $58,066.71. The low sits below every daily close the token has posted in 2026, including the 1 July close of $58,566.09, and it leaves the market 53.9% under the October 2025 record of $126,080.
The recovery is the part that changed after the flush. Between the 06:00 low and the 07:00 close at $58,227.90, the pair gained 5.62%, and the following hour traded as high as $58,672.05, briefly back above the level that had been the year’s floor. Price is now 0.73% under that 1 July close rather than the 5.87% it printed at the low.
Nothing in the move starts with a fresh US data release. It came in two legs: one during Friday’s US cash session, when the Nasdaq Composite fell 5.28%, and a second in the thin Saturday Asian session, hours after CME’s bitcoin futures had stopped trading for the weekend. Gold fell 4.62% to $3,515.40 in the same session and the 10-year Treasury yield slipped to 4.92% from 5.04%. When yields fall and bitcoin falls with them, the textbook discount-rate explanation does not fit the tape.
Where the Selling Actually Happened
Binance’s hourly spot bars put the first break at 15:00 UTC on Friday. BTC closed the 14:00 hour at $61,770.01 and the 15:00 hour at $59,475.47, a 3.71% drop in sixty minutes on 5,996 BTC of volume, about 6.4 times the 943 BTC traded in the hour before. That hour overlaps the US equity open, and it is the same window in which the Nasdaq Composite lost 5.28% on the day.
The second leg ran across four hours of the Saturday session and ended with the cycle’s lowest print. BTC closed the 02:00 hour at $58,589.22 and the 03:00 hour at $56,740.43, a 3.16% slide on 5,598 BTC. The 04:00 hour took out $55,555.55 on 6,118 BTC, the heaviest single hour of the 72 measured here. The 05:00 hour made a higher low at $55,716.48 and closed at $55,792.83, which looked like stabilisation, and then the 06:00 hour took out both numbers: a $55,130.00 low, a $58,066.71 close, and 5,254 BTC of volume doing the work.
| Hour (UTC) | Open | Low | Close | Move | Volume (BTC) |
|---|---|---|---|---|---|
| 20 Nov, 14:00 | $61,882.01 | $61,344.74 | $61,770.01 | -0.18% | 943 |
| 20 Nov, 15:00 | $61,770.01 | $59,388.00 | $59,475.47 | -3.71% | 5,996 |
| 20 Nov, 18:00 | $59,164.35 | $58,055.00 | $58,418.01 | -1.26% | 2,871 |
| 21 Nov, 02:00 | $59,030.84 | $58,578.45 | $58,589.22 | -0.75% | 1,489 |
| 21 Nov, 03:00 | $58,589.23 | $56,400.00 | $56,740.43 | -3.16% | 5,598 |
| 21 Nov, 04:00 | $56,740.43 | $55,555.55 | $56,300.89 | -0.77% | 6,118 |
| 21 Nov, 05:00 | $56,300.89 | $55,716.48 | $55,792.83 | -0.90% | 2,751 |
| 21 Nov, 06:00 | $55,792.83 | $55,130.00 | $58,066.71 | +4.08% | 5,254 |
| 21 Nov, 07:00 | $58,066.71 | $57,736.86 | $58,229.05 | +0.28% | 3,196 |
The sequencing matters for anyone trying to attach a single cause. The first leg had an equity market next to it. The second did not: CME’s bitcoin futures trade Sunday through Friday, so the Saturday session that produced the cycle’s lowest print ran on offshore perpetual venues and spot books with US futures closed. Thin books do not create selling, but they let less selling move price further, and the 06:00 hour shows the same mechanism working in reverse.
The Sixth Hour Was Short Covering, Not New Buying
Derivatives data separates the two halves of Saturday’s move. On Binance’s BTCUSDT perpetual, open interest in BTC terms fell through the entire flush and kept falling through the rebound. It stood at 96,082 BTC worth $5.661 billion at 00:00 UTC, at 95,493 BTC worth $5.373 billion at 05:00, at 95,306 BTC worth $5.315 billion at 06:00, and at 94,739 BTC worth $5.498 billion at 07:00.
Read that last pair of snapshots together. Price rose 4.08% during the 06:00 hour while the BTC-denominated open interest fell 567 BTC, or 0.59%, and the notional value rose $183 million. The $183 million is arithmetic, not demand: it is what happens to a shrinking contract count when the price under it rallies. Positions were being closed during the rally, which is the signature of shorts taking profit rather than new leveraged length arriving.
Funding tells the same story from the other side. The 8-hour rate on the same contract ran +0.0094% at the 19 November 00:00 settlement, +0.0020% at 20 November 00:00, +0.0007% at 20 November 08:00, +0.0026% at 20 November 16:00, and -0.0061% at 21 November 00:00. Annualised at three settlements a day, that is a move from roughly +10.3% to roughly -6.6% in 48 hours. Longs spent the first half of the week paying to hold the position and the last settlement paying them instead.
A negative rate does not mean the market is bearish. It means the marginal position is short and has to pay to stay short, which is what a reduced long book looks like once the clearing has happened. The taper across five settlements is more informative than the sign flip on its own: it shows the long side losing its bid to pay, in steps, before the break.
Yields Fell, and That Is the Part the Rates Story Misses
The Treasury’s own daily par yield curve for 20 November shows the 10-year at 4.92%, down from 5.04% a day earlier. The 2-year went from 4.76% to 4.63%, and the 30-year from 5.40% to 5.31%. On the real curve, the 10-year fell to 2.77% from 2.88%.
Every tenor in that table rallied. If bitcoin were selling off because the market marked up the path of policy rates, the short end would have moved the other way. It did not. The move instead looks like a portfolio event: equities down 5.28%, front-month COMEX gold down 4.62%, Treasuries bid, bitcoin down as much as 8.97% at the Saturday low. Gold falling alongside equities is the awkward detail. An inflation or policy shock usually sends gold up. A dash for cash sends everything down at once, including the hedges.
That reading is an inference, not a measurement. Nothing in the public data for Saturday identifies which holders sold or why, and the available evidence does not establish forced selling as the cause. What the data does establish is that the rate story cannot carry the whole explanation on its own. Whatever did the damage happened while the policy path was being marked slightly easier, not harder.
The Board: High-Beta Names Took the Worst of It
The sell-off was not evenly distributed. Measured against bitcoin’s 5.72% decline, the higher-beta tokens absorbed a multiple of it while the largest alternatives tracked close to the leader.
| Asset | Price | 24 hours | 7 days | 30 days | Market cap |
|---|---|---|---|---|---|
| Bitcoin (BTC) | $58,136 | -5.72% | -13.75% | -30.00% | $1.169T |
| Ethereum (ETH) | $1,633.18 | -6.32% | -13.96% | -32.78% | $199.6B |
| BNB | $526.32 | -7.66% | -15.26% | -28.84% | $69.2B |
| XRP | $0.8970 | -6.92% | -9.76% | -33.09% | $57.0B |
| Solana (SOL) | $67.87 | -6.28% | -10.19% | -35.05% | $40.2B |
| Hyperliquid (HYPE) | $58.73 | -10.79% | -15.67% | -25.53% | $14.0B |
| Zcash (ZEC) | $731.89 | -13.86% | -19.78% | -42.06% | $12.5B |
| NEAR | $2.69 | -11.40% | -19.42% | -45.81% | $3.5B |
Zcash’s 13.86% decline is 2.42 times bitcoin’s and NEAR’s 11.40% is 1.99 times. Ethereum’s 6.32% is 1.10 times, so the second-largest asset behaved like a slightly levered version of the first. The ratio is the useful part: the same selling lands hardest on the names that have already lost the most. Over 30 days, Zcash is down 42.06% and NEAR 45.81% against bitcoin’s 30.00%.
Sentiment data agrees on direction and disagrees on novelty. The Fear and Greed index sits at 12 for 21 November, in “extreme fear”, the same reading as 20 November and within three points of every day since 14 November. It was 28, still “fear”, on 12 November. The market has been frightened for more than a week; Saturday removed the last of the optimism that survived the earlier decline, and the 06:00 rebound did not move the reading.
Where $58,136 Sits
Four reference points matter now, and all four come from the same data set so they can be compared honestly. The 24-hour high is $62,341.94 on Binance spot. The 2026 low close, before this week, was $58,566.09 on 1 July. Saturday’s intraday low was $55,130.00. Saturday’s recovery high was $58,672.05.
The $58,566.09 level is the one that decides how this week gets read. It had defined the year’s floor on a closing basis, price broke it by 5.87% at the low, and it has now been reclaimed for one hour without being held. A daily close back above it would turn Saturday’s break into a wick rather than a trend change. That is the cleanest invalidation available for the bearish reading, and at $58,136 the level is $430 away rather than the $3,436 it was at the low.
The longer arithmetic is less kind. From the $126,080 record set on 6 October 2025, bitcoin is down 53.89%, and a full recovery would require a 116.9% gain from here. Measured from the 1 November close of $77,520.89, the month is down 25.0%. Market capitalisation has fallen by $70.8 billion in 24 hours to $1.169 trillion, and circulating supply of 20.115 million coins means every $1,000 of price is worth about $20.1 billion of valuation.
The December Question Has Not Changed
None of this alters what the Federal Reserve’s October meeting minutes said when they were published on 18 November. The committee held the target range at 3-3/4 to 4 percent, with “10 members agreed”, and the minutes record that “two members voted against the decision to maintain the target range for the federal funds rate, preferring an increase of 25 basis points in the target range at this meeting”.
The staff’s inflation estimate in the same document explains why the dissent existed: “price inflation—as measured by the 12-month change in the price index for total personal consumption expenditures (PCE)—rose to 3.6 percent in September, boosted by a rapid increase in consumer energy prices.” Core PCE was estimated at 3.1%. The staff also flagged “the possibility that longer-run inflation expectations could have become unanchored after five years’ worth of elevated inflation as a salient risk”.
A 25 basis point increase in December would take the range to 4.00% to 4.25%. The full account of that release is here , and the positioning picture that preceded Saturday is here .
What Would Prove the Flush Is Finished
Three conditions, in the order they usually appear. First, open interest stops falling while funding stays negative, which is what a market looks like when leveraged length has been cleared and shorts are paying to stay. Saturday’s numbers are a start, not a completion: open interest in BTC terms is still 1,343 BTC below the 00:00 snapshot, and the negative funding settlement is a single data point.
Second, a daily close above $58,566.09. Saturday’s 07:00 high of $58,672.05 briefly cleared it and the session gave it back, which is what a test looks like before it is either confirmed or rejected. A close above would put price back inside the range that held all year and mark Saturday as an overshoot.
Third, a session in which gold and bitcoin stop falling together. That is the tell that the cash-raising phase has ended, because the two assets fall in unison only when holders are selling what they can rather than what they want to. Friday and Saturday both failed that test.
None of those is a forecast. They are the observations that would separate a leverage flush from the start of something longer, and until they appear the honest description of this market is a downtrend that has just put in its lowest print of the year and recovered most of it inside two hours.
Frequently Asked Questions
Bitcoin is at $58,136, down 5.72% in 24 hours, after two selling legs. The first was a 3.71% drop in the 15:00 UTC hour on Friday as the Nasdaq Composite fell 5.28%. The second ran from 03:00 to 06:00 UTC on Saturday, took price to $55,130.00, and was followed by a 4.08% rebound in the 06:00 hour. Binance perpetual funding turned negative and BTC-denominated open interest fell through both the drop and the recovery.
The low on Binance’s BTC/USDT spot pair was $55,130.00 in the 06:00 UTC hour on 21 November. That is 5.87% below the 1 July close of $58,566.09, which had been the lowest daily close of 2026, and 56.3% below the record of $126,080 set on 6 October 2025.
The Treasury data does not support that as a sole explanation. On 20 November the 10-year yield fell to 4.92% from 5.04% and the 2-year fell to 4.63% from 4.76%, so the policy path was being marked slightly easier, not tighter, as bitcoin fell. The December rate question from the October minutes remains open, but lower yields and a lower bitcoin price in the same session point to portfolio deleveraging rather than a rate shock.
The derivatives data points to short covering. During the 06:00 hour, price rose 4.08% while open interest on Binance’s BTCUSDT perpetual fell from 95,306 to 94,739 BTC. Notional value rose $183 million only because the price under a shrinking contract count rallied. New leveraged length would have shown open interest rising with price.
A daily close above $58,566.09, the 1 July close that had been 2026’s lowest, would put bitcoin back inside the range that held for most of the year and turn Saturday’s break into an overshoot. A daily close below $55,130.00 would confirm the break and leave no 2026 reference level below it.
Prices and market capitalisation are CoinGecko readings at 07:41 UTC on 21 November 2026; hourly bars, volume, open interest and funding are Binance BTCUSDT spot and perpetual data; yield data are the US Treasury’s daily par yield curve and daily real yield curve for 20 November 2026; the equity and gold moves are Friday’s closes.
Data: CoinGecko , Binance Futures , Bybit , US Treasury , Federal Reserve , Alternative.me .
Disclosure: This article does not represent investment advice. The content and materials featured on this page are for educational purposes only.
The post Why Is Bitcoin Down Today? BTC Rebounds to $58K After $55.1K Flush appeared first on BlockchainReporter .