



NEAR traded at $2.74 at 02:59 UTC on 21 November, down 10.6% in 24 hours inside a range of $2.74 to $3.07, according to CoinGecko price data . Bitcoin fell 5.57% over the same window and ether 7.21%, so the token moved about 1.9 times as far as the largest asset in the market on a day when almost nothing in the top twenty was spared.
The size of the drop is the less interesting number. The level is the interesting one. NEAR closed on 20 November at $3.205 and the latest print is $2.74, which puts it fractionally below its 200-day average of $2.7365 and 36.9% below its 50-day average of $4.3332. The token has not closed below that 200-day line since 19 August, when it traded at $1.588. It has spent 94 consecutive sessions above it, through a rally to $5.888 on 12 October and the entire slide back.
Two things now sit on the same chart. The first is a broad repricing of risk assets, with NEAR carrying a 16.5% turnover ratio against bitcoin’s 4.6%. The second is a supply schedule that NEAR’s governance forum lists as final, and which reduces the protocol’s maximum annual issuance from 2.5% to 1.6% over 24 months. The first explains the speed of the move. The second decides what the token is worth if the market stops moving.
What the 200-Day Average Means at $2.74
The 200-day average is the arithmetic mean of the last 200 daily closes on CoinGecko’s NEAR/USD series, currently $2.7365. It is rising, because the closes it is dropping off the back of the window are lower than the ones entering it. That makes the line a moving floor rather than a fixed one: the level NEAR has to defend rises a little each day, and it stood at $2.52 on 1 November.
On the data, three levels matter more than the round numbers. The 200-day average at $2.7365 is the only support in the series with a measured basis. Below it, the 15 November close of $3.028 already failed as a floor. Above, resistance sits at the 20 November close of $3.205, then at $3.392, the 18 November close that followed a 7.4% single-session gain.
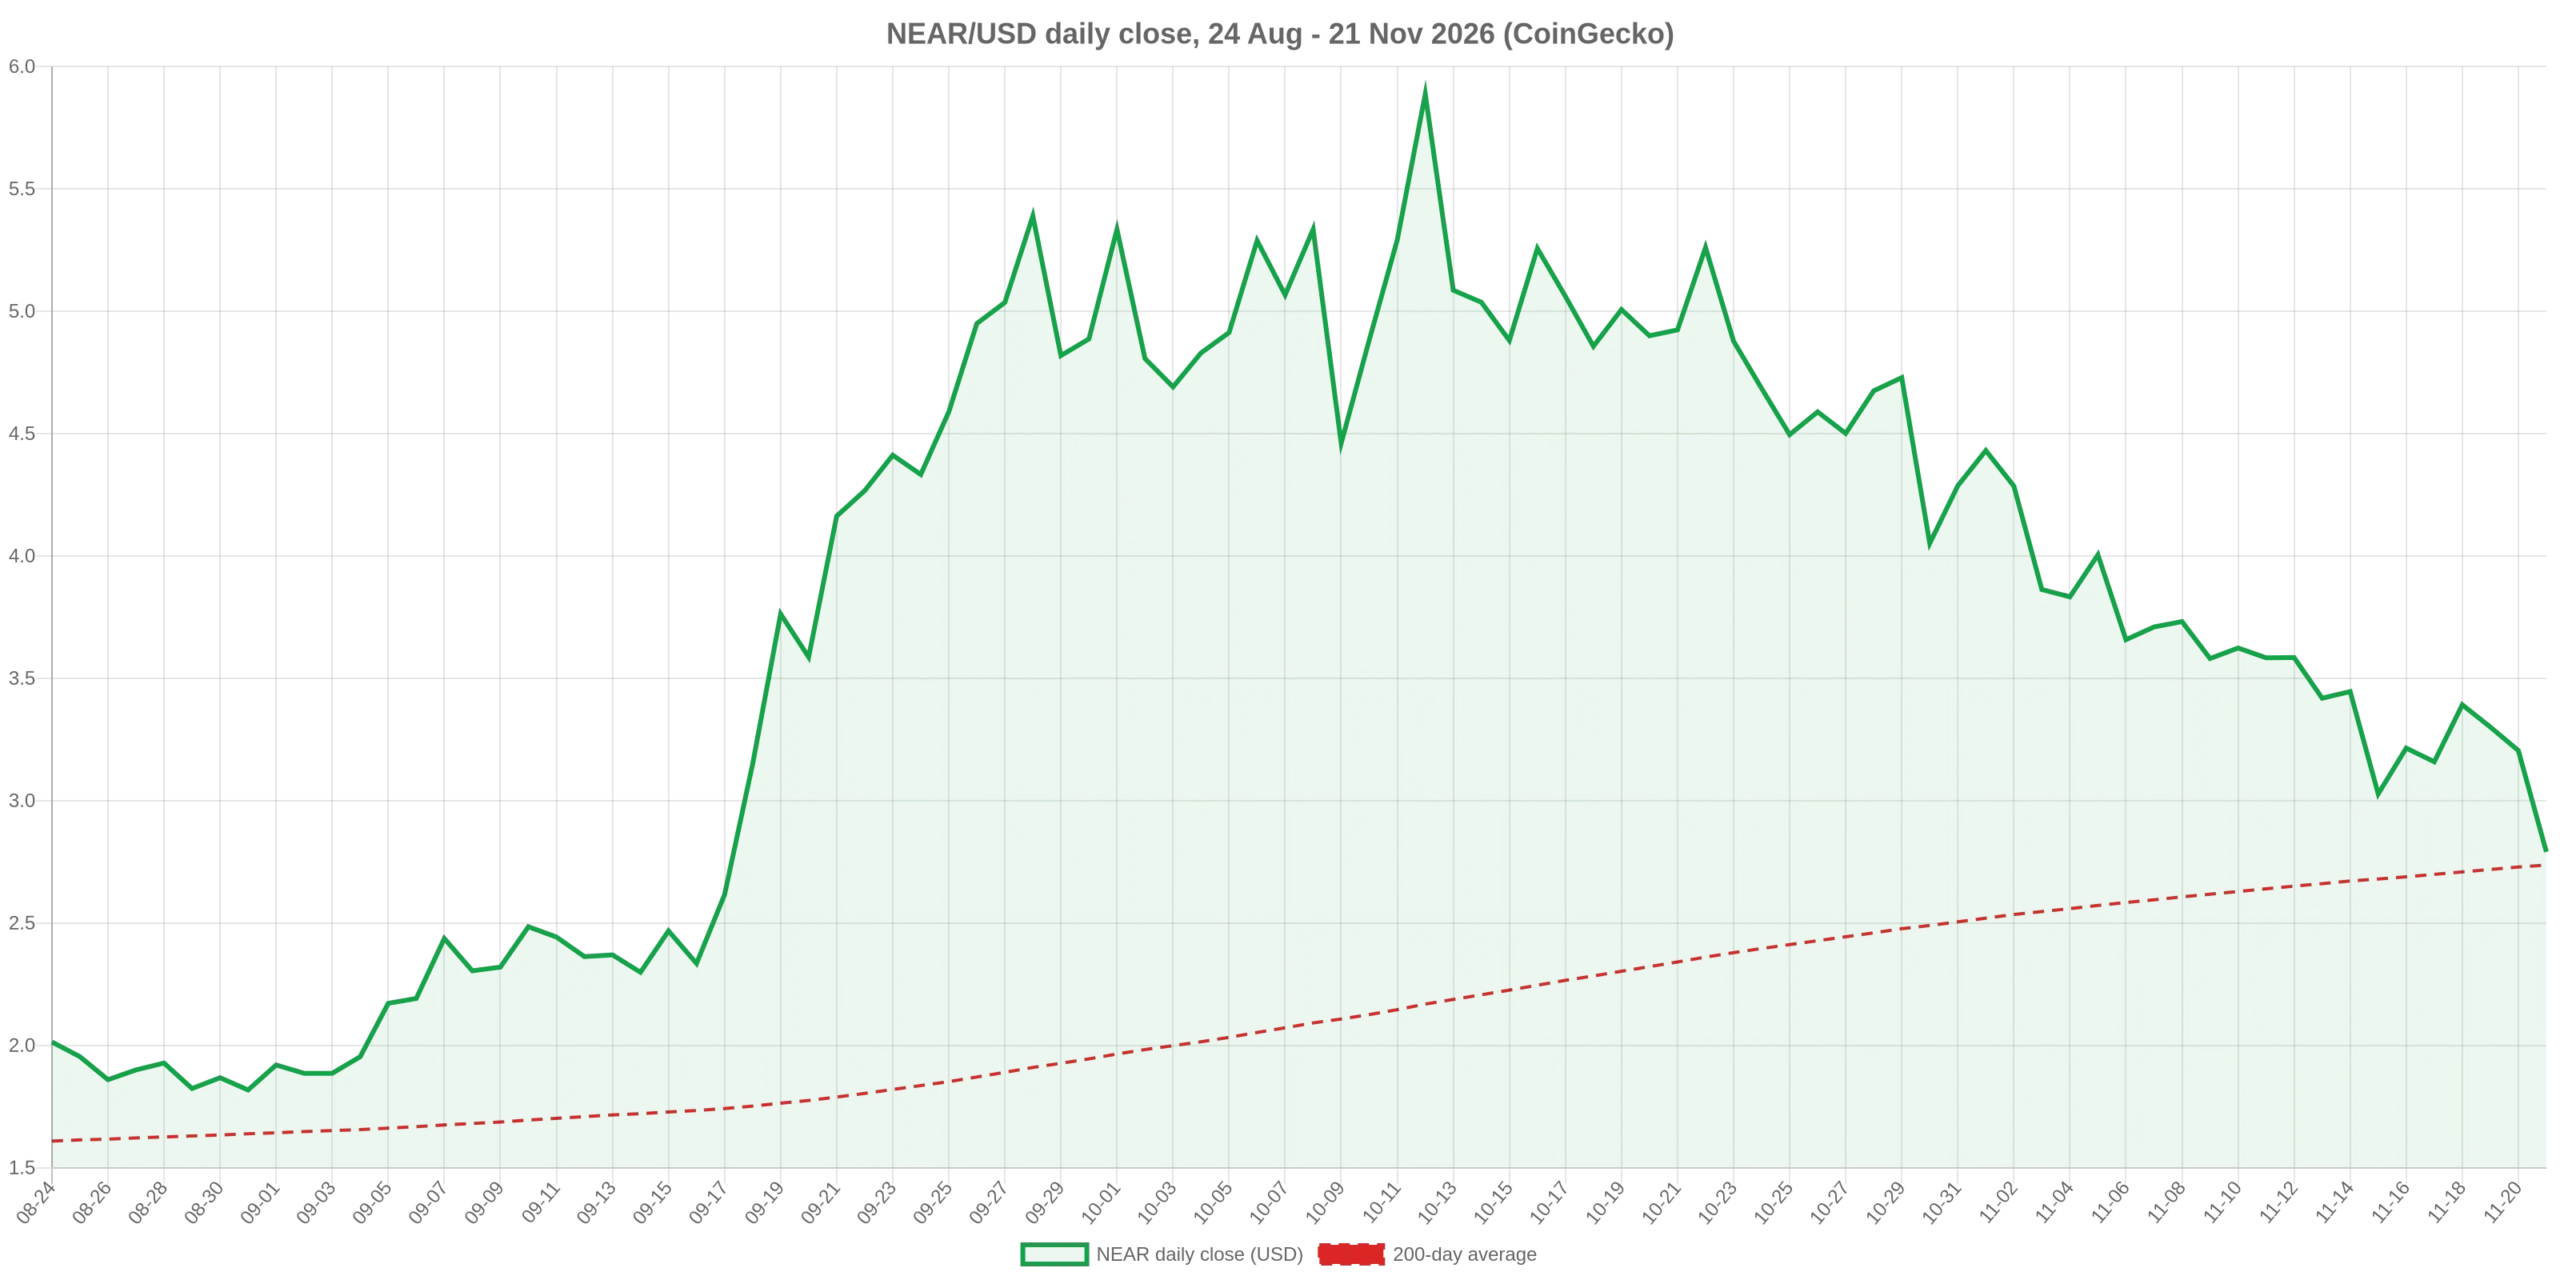
The conditional read is straightforward. If NEAR closes below $2.7365 on two consecutive daily candles, the three-month pattern of trading above the long average ends, and the next measured reference is the 31 August close of $1.818, where the token based before its September re-rating. If it holds above the average into the weekly close on 22 November, the drawdown looks like a retest of a rising line rather than a trend break. That is a description of the chart, not a forecast.
The volatility behind the move is measurable. Daily returns over the last 30 sessions have a standard deviation of 5.63%, which annualises to roughly 108%. Over the last seven sessions the same measure is 7.9%. A token with that dispersion can lose 10.6% in a day without anything happening to its own fundamentals, which is why the price needs to be read next to the supply schedule rather than instead of it.
The damage from the October high is already large. NEAR is 38.2% lower than its 1 November close of $4.431, 53.5% below the 12 October high of $5.888, and 86.6% below its all-time high of $20.44. It is still 183.8% above the 12 February low of $0.964, a reminder that the same token gained roughly threefold from that base before this month’s reversal. Readers who want the longer context on how NEAR’s ecosystem has been building through that range can start with the NEAR Mobile rankings milestone .
The Supply Change That Landed Before the Selloff
NEAR’s House of Stake forum hosts proposal HSP-029, “Establish a 24-Month Issuance Ramp to a 1.6% Target Rate Of NEAR Token Emissions”, whose frontmatter lists its status as Final. The full proposal text sets out a single-parameter change with a published formula: the annual cap falls from 2.5% to 1.6% along cap(t) = 2.5% minus 0.9% multiplied by min(t, 24)/24, where t is months elapsed from activation, interpolated per epoch. That works out to roughly 3.75 basis points of the cap per month.
The document is explicit about what it does not do. “Only one parameter changes. No new emissions mechanism, no redirected validator rewards, no new spending program, no oracle, no administrator,” the proposal states. It also keeps the 90/10 split between stakers and the treasury exactly as measured, and it does not touch protocol revenue: Intents fee buybacks stay removed from circulation.
Timing is the part that most summaries miss. The technical specification says “Activation occurs one full quarter after ratification.” If ratification landed in November 2026, the first monthly step of the ramp would be applied around February 2027, and the 1.6% cap would not be reached until 24 months after that. The forum text publishes a formula and a ratification-relative trigger, not a block height, so the exact epoch is not stated there.
The proposal also quantifies what delay costs, which turns the schedule into a measurable variable rather than a slogan. Its own table measures a six-year window: acting immediately avoids 66.1M NEAR of issuance, a three-month delay avoids 62.8M and forgoes 3.3M, a six-month delay avoids 59.6M and forgoes 6.5M, and a twelve-month delay avoids 53.0M and forgoes 13.1M. That is about 1.1M NEAR of forgone reduction for every month the ramp does not start.
What 11.8 Million NEAR Is Worth at $2.74
The proposal’s central claim is arithmetic: “Modeling indicates the ramp avoids 11.8M NEAR of issuance over two years and 66.1M over six years which is a supply 4.36% smaller than the status quo.” The dollar figures printed beside that table were struck at a spot price of $4.30, the level used for the simulations run against mainnet at block 216,701,043 on 22 September 2026.
At $2.74, the same token quantities are worth 36% less. The two-year reduction of 11.8M NEAR is $32.3M rather than the $50.7M it would have been at the drafting price. The six-year reduction of 66.1M NEAR is $180.8M rather than $284M. The forgone 3.3M NEAR from a three-month delay is $9.0M today rather than $14M.
A second calculation makes the scale concrete. On the current circulating supply of 1,312,269,234 NEAR, a 2.5% annual cap implies about 32.8M new tokens a year, or roughly 89,900 a day. A 1.6% cap implies 21.0M a year, or about 57,500 a day. The difference, 11.8M NEAR a year, is worth about $88,400 a day at $2.74. At full ramp that is the flow that stops arriving at the marginal seller, and it is the only part of NEAR’s supply picture with a date attached to it.
There is a version of this trade that the numbers do not support. A smaller float does not create demand. The proposal concedes the point indirectly by keeping the revenue mechanism untouched and by noting that the change “creates no spending program, no eligibility test, no oracle, and no registry”. Buybacks and burns from Intents activity are the demand-side variable, and nothing in HSP-029 sets their pace.
Stakers Give Up Yield, Non-Stakers Get Scarcity
Almost all of the cost lands on one group. Gross staking yield falls from 4.80% today to 3.93% in the first year and 3.07% by the end of the second. For a holder staking 1,000 NEAR, the proposal states the outcome plainly: that holder “ends year two with about 20 fewer NEAR than under the 2.5% inflation regime”, and needs the token to be “worth 1.66% more, or 7.9 cents, for that holder to be exactly whole”. At $2.74, 1.66% is 4.5 cents.
The other side of the ledger is larger and needs no action. “Every holder who does not stake, which is currently 57.3% of supply, is better off immediately and with no offset at all,” the proposal says. On today’s supply that is about 751.9M NEAR held outside staking, whose share of the network is diluted at a slower rate from the moment the ramp begins.
The validator data in the document is the least comfortable section. Of 405 measured pools, 24 lose economic self-sufficiency at spot at the target rate. The proposal’s answer is that issuance was never sustaining that tail: in the 163-pool entry cohort staking between 30,000 and 60,000 NEAR, the median operator runs 40,130 NEAR of delegated stake against 19 NEAR of its own, which is 0.05% of the capital it secures. Delegators who want to price that risk can read the same figures and decide where to bond.
Solana Already Ratified Its Version
The proposal leans on a comparison that is now verifiable. Solana ratified SGP-0002 on 28 August 2026 with 67.001% of stake, cutting its own issuance from 3.82% to 1.50% over 2.8 years. NEAR’s path reaches a higher target yield, 3.07% against 2.25%, on a shallower cut: gross yield compresses 36.0% on NEAR against 61.5% on Solana, while the six-year supply reduction is deeper at 4.36% against 2.60%.
That comparison is the strongest argument in the document and also the weakest piece of evidence for a price call. Solana’s ratification did not stop its token from trading with the rest of the market in November, and NEAR’s own rally from $0.964 in February to $5.888 in October happened while the 2.5% cap was in force. Supply changes of this size operate on a two-year clock. Daily price moves operate on a different one, and conflating them is how a supply story becomes a bad trading thesis. Readers comparing the two networks on other measures can use the earlier relative-strength comparison across the majors .
What Would Change This Picture
Three observable things would force a different reading. The first is the 200-day average. Two consecutive daily closes below $2.7365 would end the pattern that has held since August and put the 31 August close of $1.818 back in play as the next measured reference. The second is the ramp’s start. Because activation is tied to ratification plus one quarter, any revision to the ratification date shifts the supply reduction by about 1.1M NEAR per month, worth roughly $3.1M at today’s price. The third is the demand side: Intents buyback activity is the only mechanism in the document that removes supply faster than the cap does, and the proposal leaves its pace unstated.
What the evidence does not support is a causal story for the 20 and 21 November decline specific to NEAR. No filing, exchange notice or governance event on those dates explains a 10.6% single-session move in this token. The decline coincided with a broad risk-off session in which bitcoin lost 5.57% and ether 7.21%, and with a turnover ratio roughly 3.6 times bitcoin’s, which is what a thinner book looks like when the same order flow arrives. Attributing the move to the issuance cut would require evidence that does not exist, and the document itself argues the opposite timescale.
What remains measurable is narrower and more useful. A token that has held a rising 200-day average for 94 closing sessions is now trading within a tenth of a cent of it, against a supply schedule that removes about 11.8M NEAR a year of new issuance once the ramp completes, at a dollar value that has fallen by a third since the proposal was modelled. Both numbers will be recalculated by the market long before the 24-month ramp finishes.
Data: CoinGecko , NEAR House of Stake .
Disclosure: This article does not represent investment advice. The content and materials featured on this page are for educational purposes only.
Frequently Asked Questions
NEAR traded at $2.74 at 02:59 UTC on 21 November 2026, down 10.6% in 24 hours, with an intraday range of $2.74 to $3.07 and a market value of about $3.59 billion, according to CoinGecko.
The move coincided with a market-wide risk-off session in which bitcoin fell 5.57% and ether 7.21%. NEAR’s own turnover ratio of 16.5% of market value, against 4.6% for bitcoin, means the same selling had a larger price effect. No NEAR-specific filing or governance event on 20 or 21 November explains the size of the decline.
The only support with a measured basis is the 200-day average at $2.7365, calculated as the mean of the last 200 daily closes. NEAR trades on it and has not closed below that line since 19 August 2026, when it traded at $1.588.
Yes. Proposal HSP-029, listed as Final on NEAR’s House of Stake forum, reduces the maximum annual issuance from 2.5% to 1.6% over 24 months at roughly 3.75 basis points a month, keeping the 90/10 split between stakers and the treasury. Activation occurs one full quarter after ratification.
The proposal models 11.8M NEAR of avoided issuance over two years and 66.1M over six years, a supply 4.36% smaller than the status quo. At $2.74 those quantities are worth about $32.3M and $180.8M, roughly a third less than the dollar figures modelled at $4.30 in September 2026.
Gross staking yield falls from 4.80% now to 3.93% after the first year of the ramp and 3.07% by the end of the second. A holder staking 1,000 NEAR ends year two with about 20 fewer NEAR than under the current 2.5% cap, per the proposal’s own modelling.
The post NEAR Price Today: NEAR Reaches $2.74 as the 200-Day Average Becomes the Test appeared first on BlockchainReporter .